March 6, 2015
If the tuning curve was right, removing wood from the ends of the bar would raise the frequency of both the first and second modes. So I decided to test this theory, thinking that it would come in handy if I overdid the sanding on one of my rosewood bars. So I began removing wood from the ends to see if the bar would get sharper.
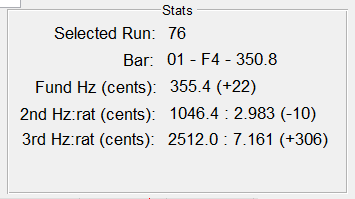
It had been a few weeks since I tuned the bar, so before I started hacking on it, I remeasured its modes on the tuning station. Here was the result:
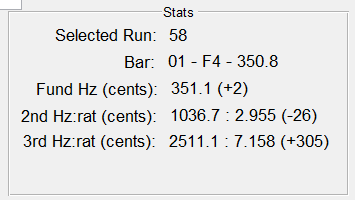
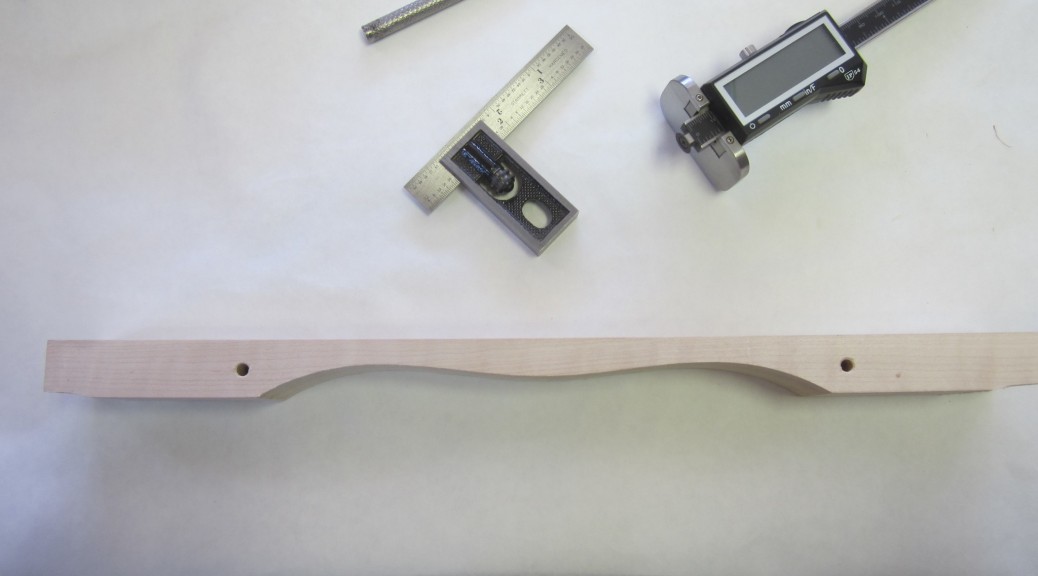
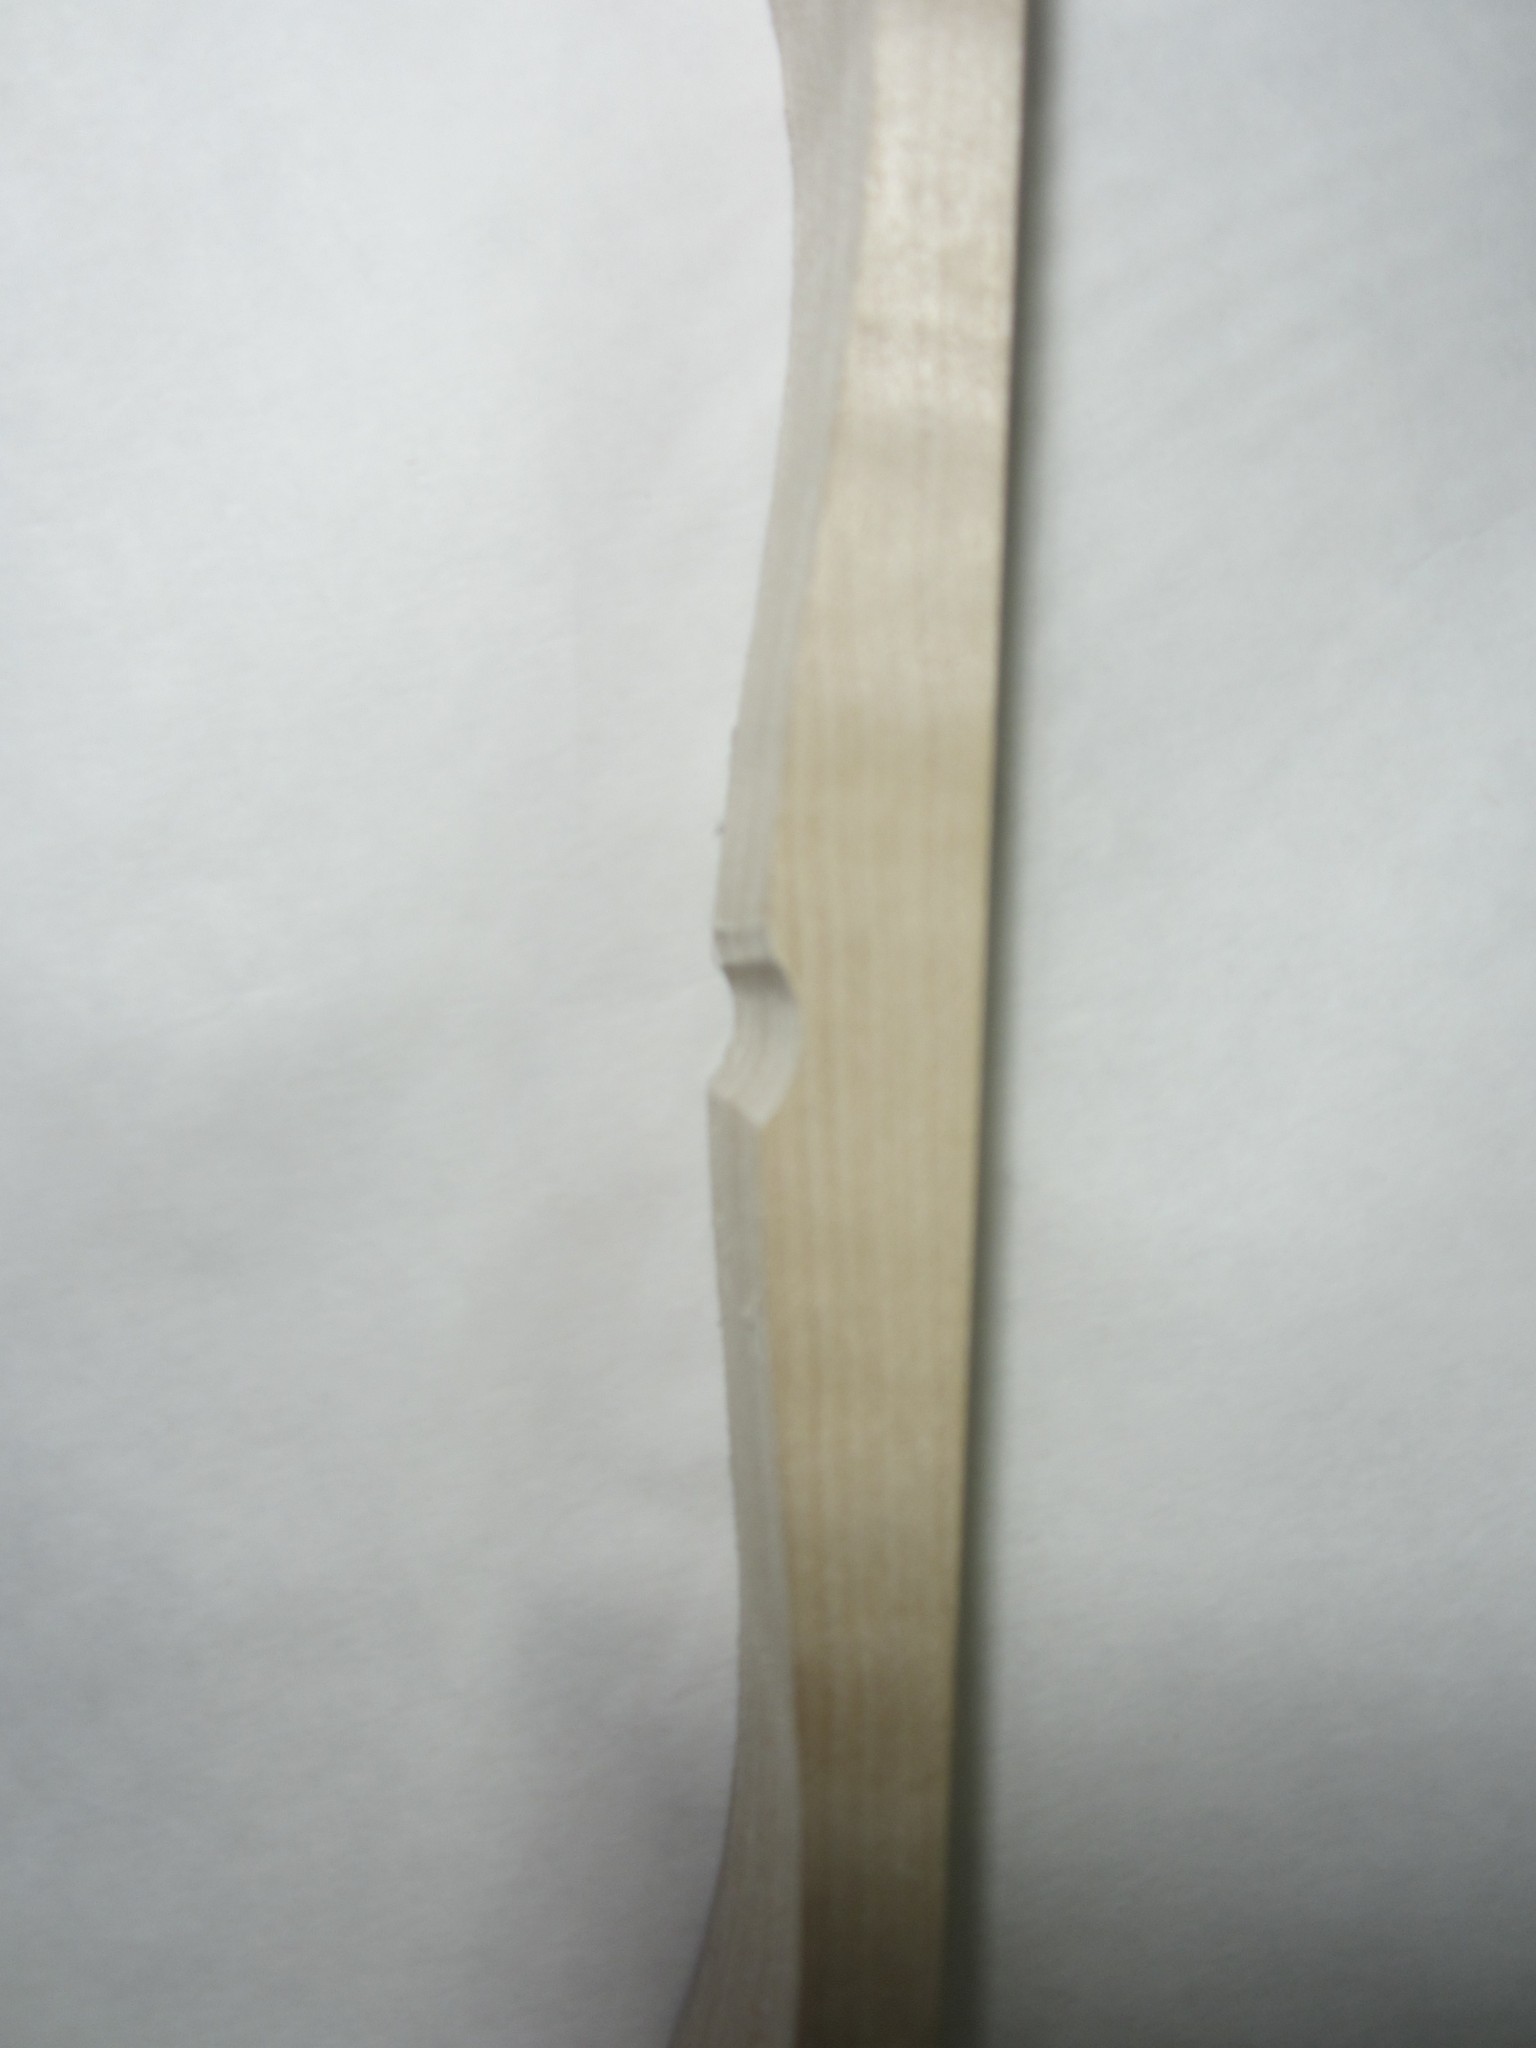
Weird. The fundamental had only changed a couple of cents, but the second mode got flatter! Not sure what happened here. I am speculating that it was a change in humidity, but I am not sure. Temperature can also affect the frequencies, but only weakly (more on that later). I measured the frequencies a few times and they were consistent, so it wasn’t a problem with the software. In any case, with the baseline re-established, I started removing wood from the ends. I measured the partial frequencies m times along the way. After my last sanding session, I took the following photos of the bar ends.
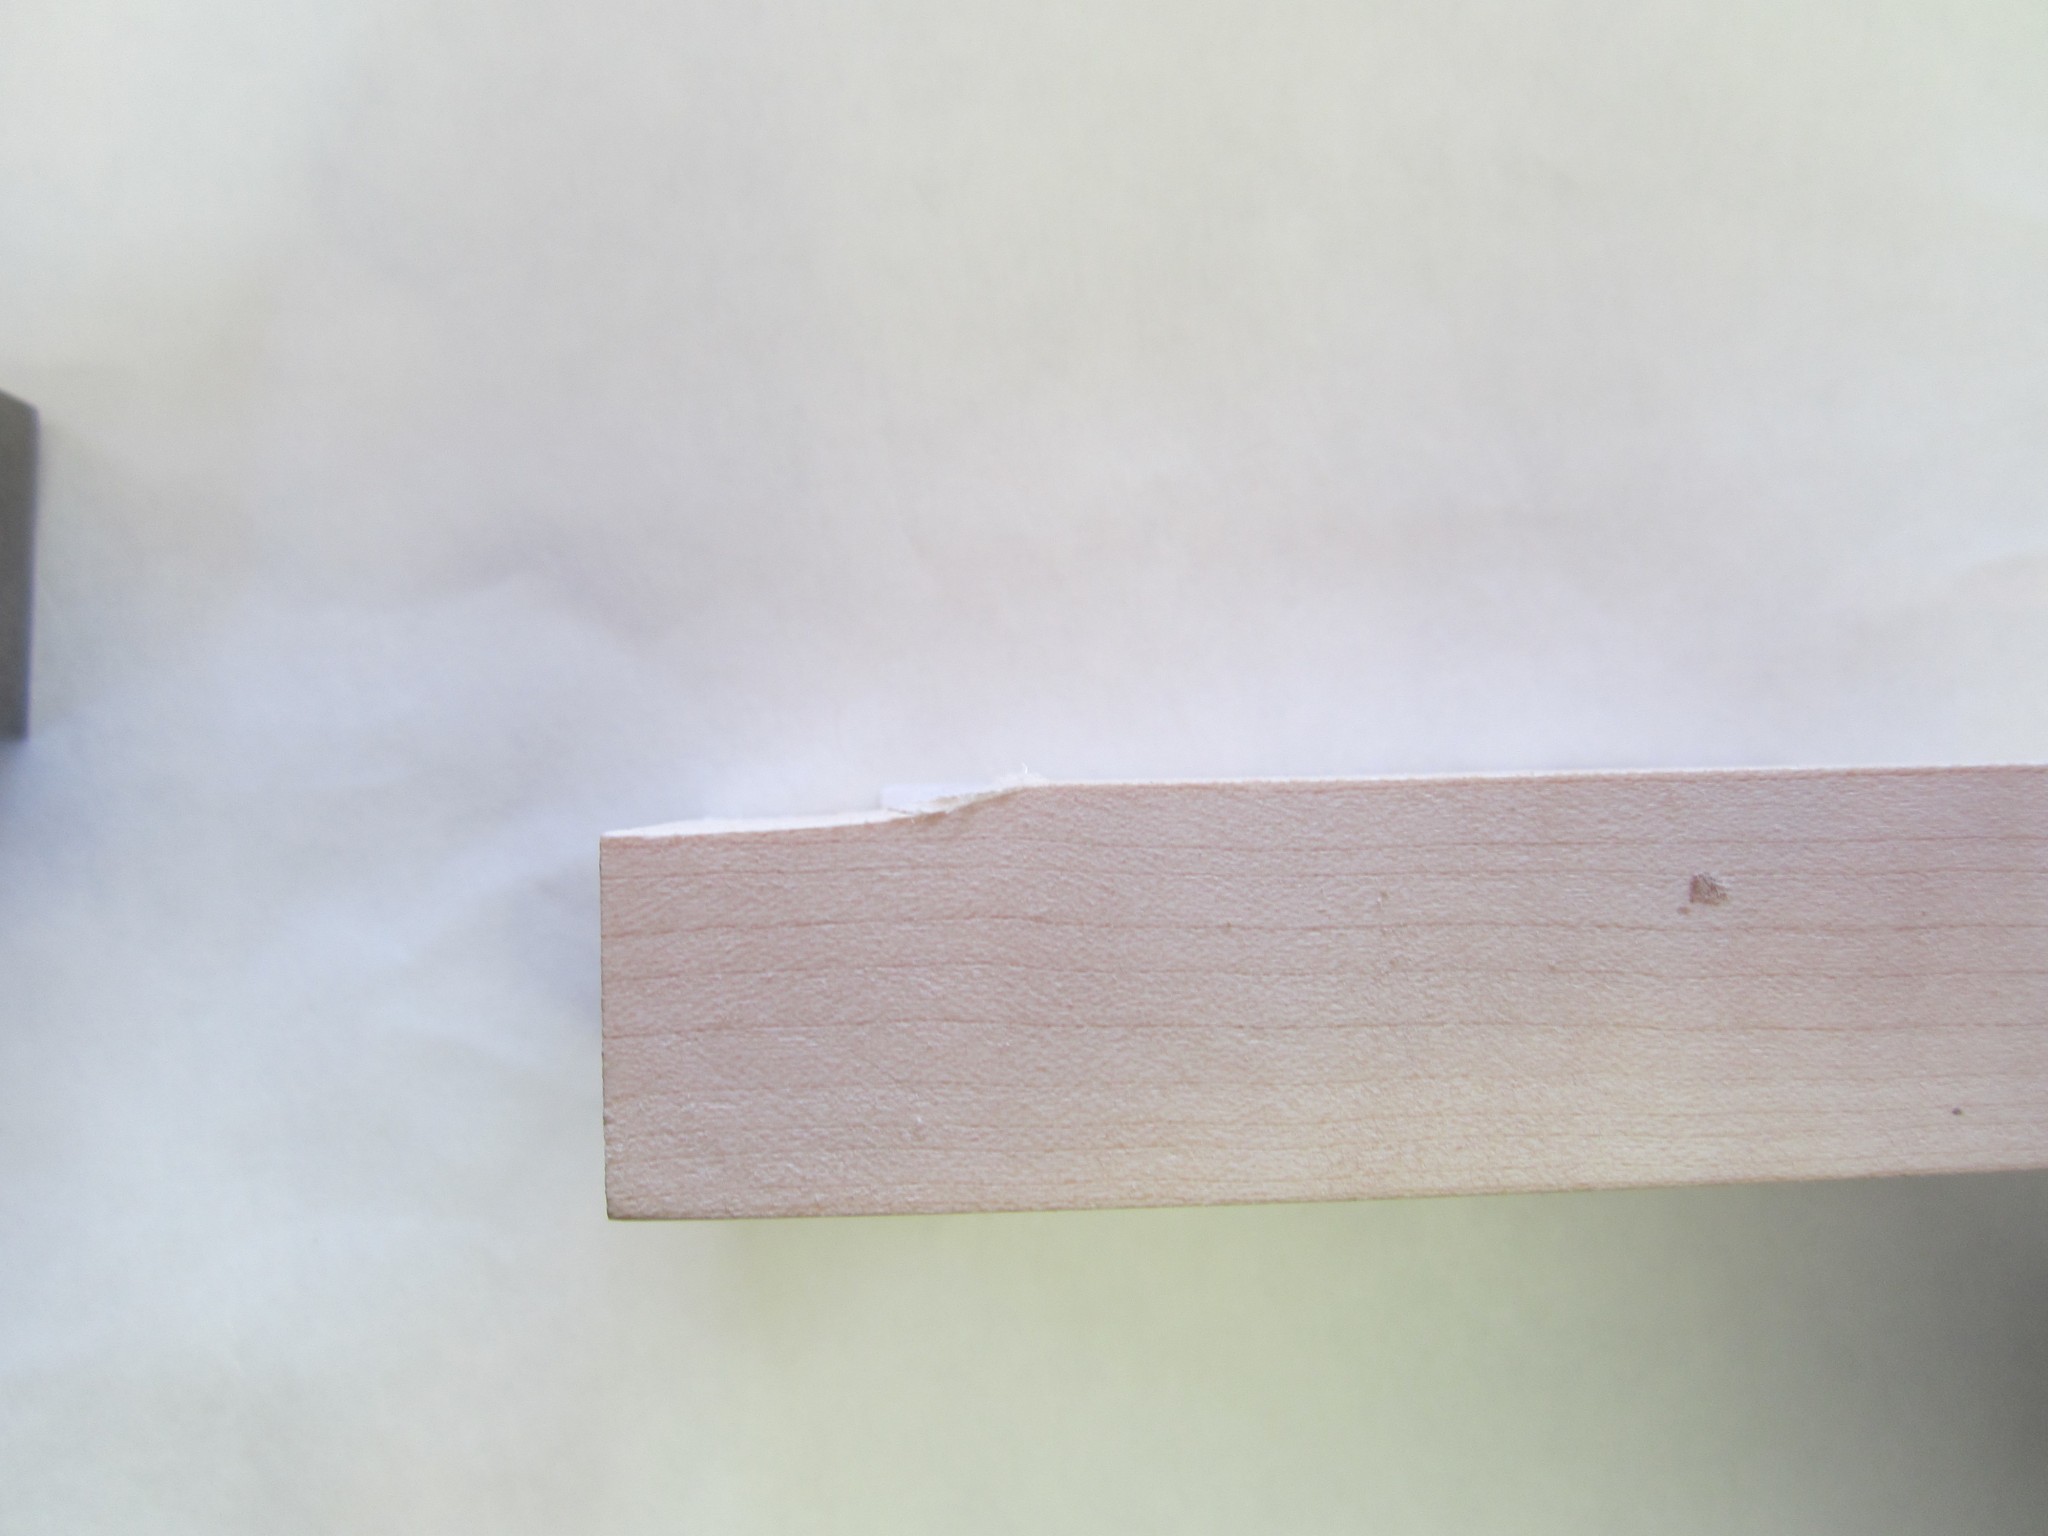
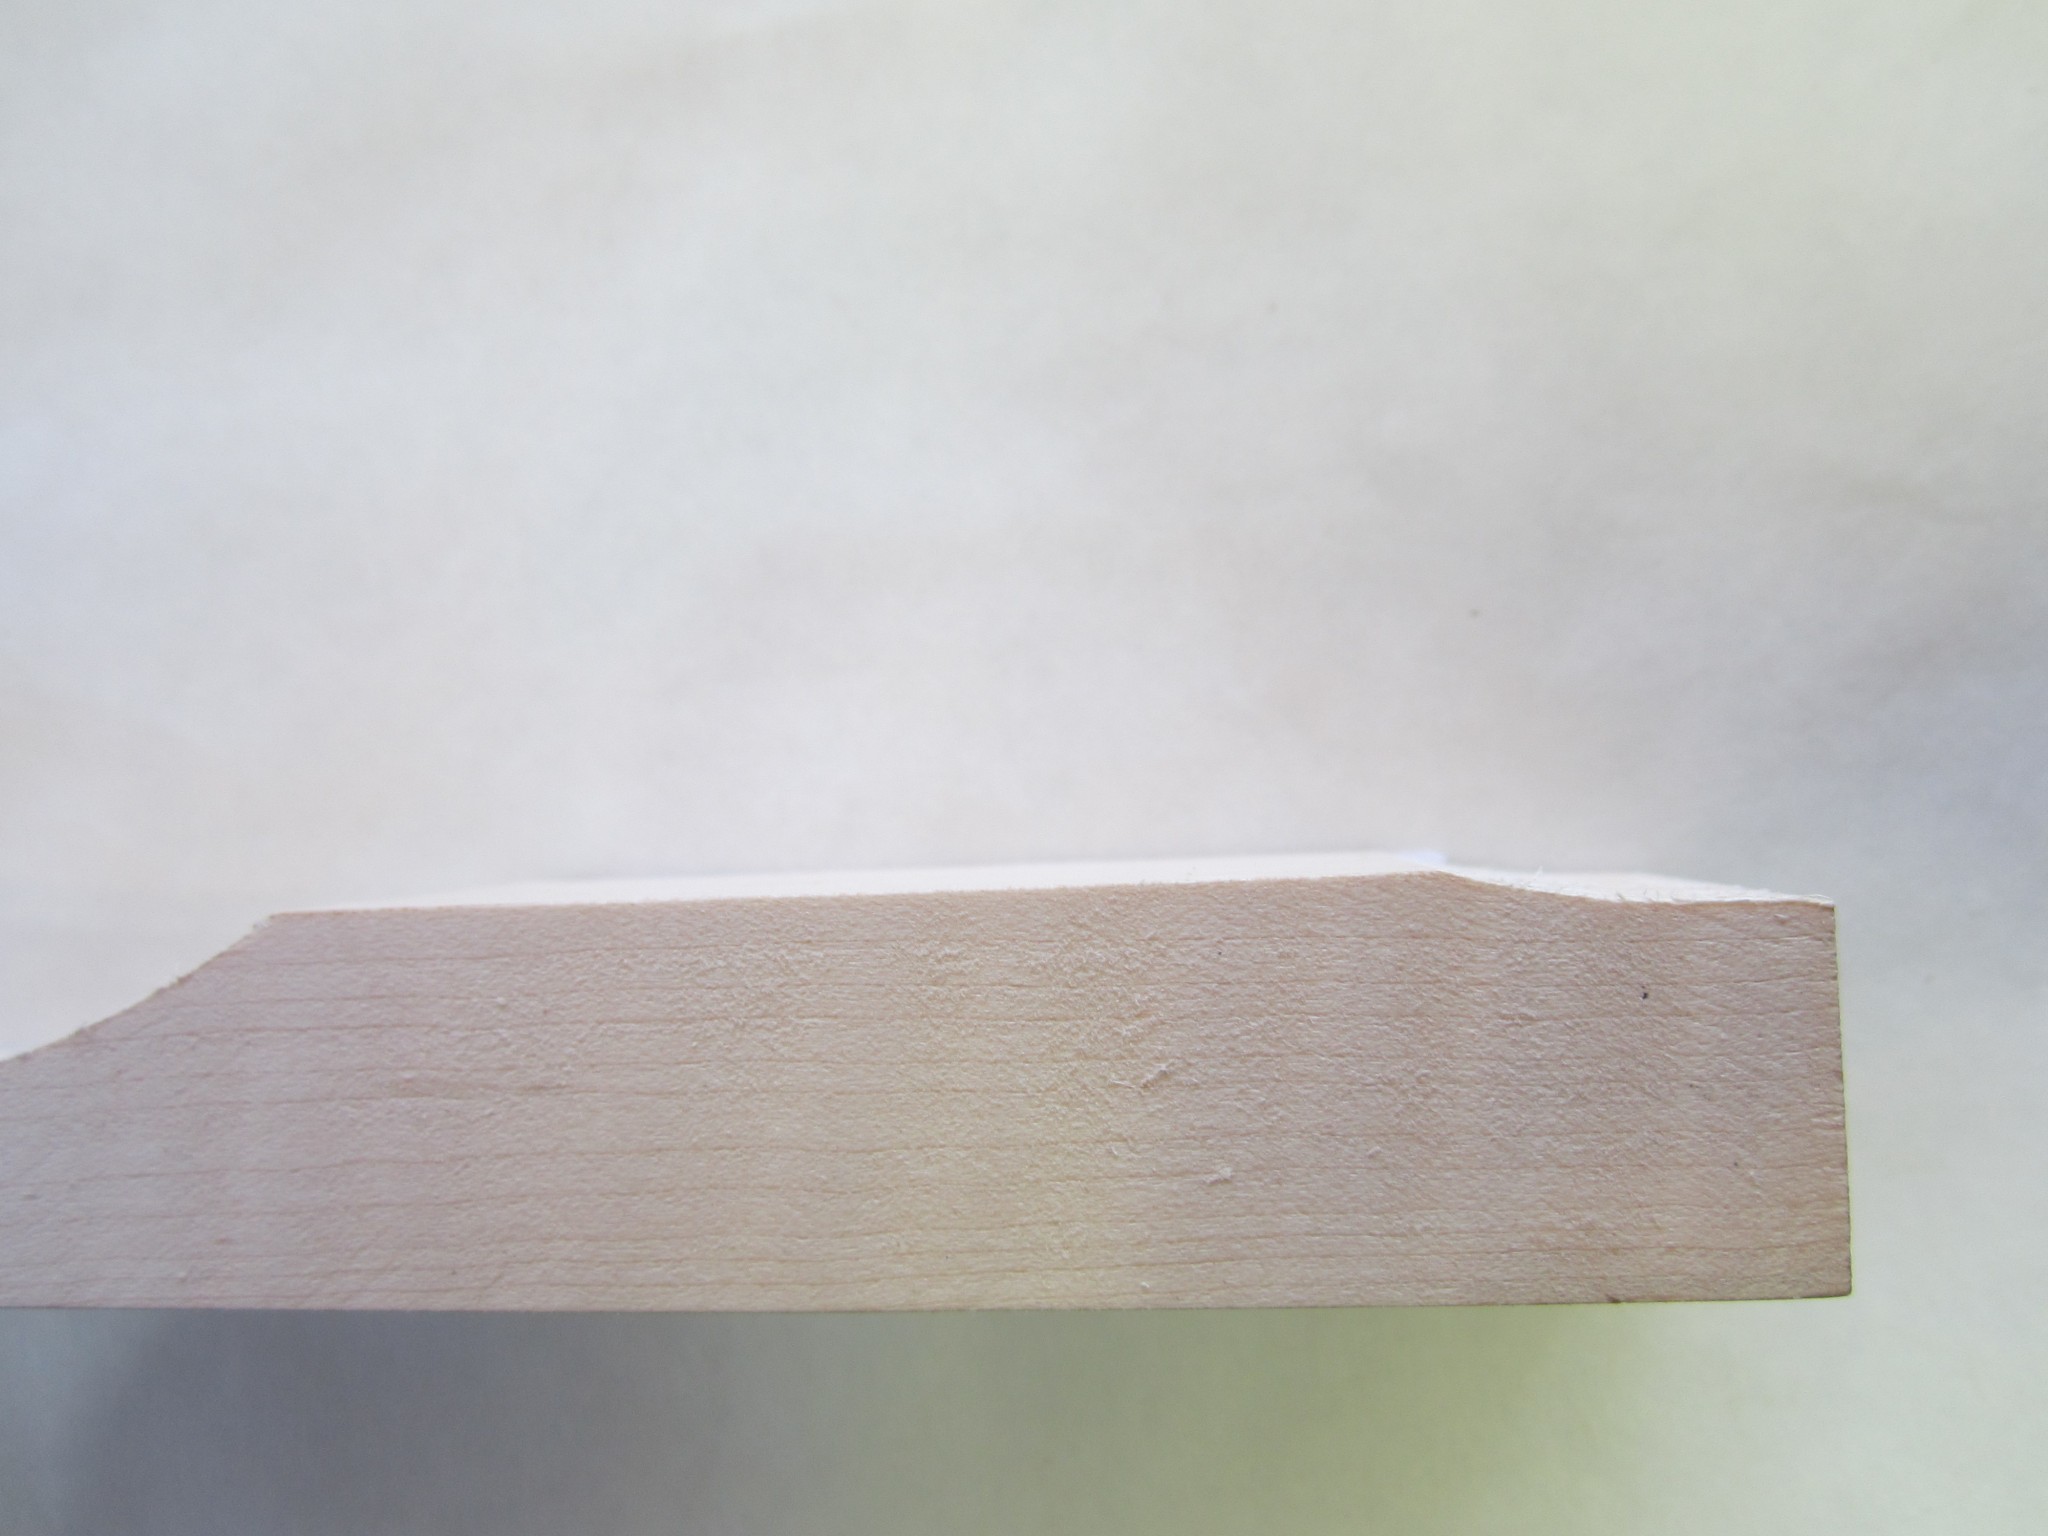
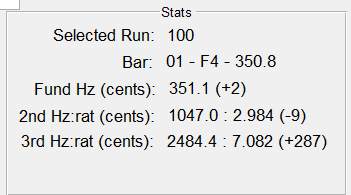
I removed a little over 2 mm of wood from both ends. This wood removal resulted in the following new modes:
Cool! Both the first and second partial frequencies increased quite a bit- just as the tuning curves predicted.
More Tuning Curve Verification – Notching the Bar Center
The previous experiment verified that the tuning curves accurately predicted the sonic effects of removing wood from the ends of the bar. As previously noted, the curves also predict that wood removed from the center of the bar will flatten the fundamental frequency, while having minimal impact on the second partial. Since this is crucial to my tuning approach, I set out to verify this prediction.
Like the previous experiment, my approach was to incrementally remove wood with the drum sander, while frequently measuring the affects on the partials. Previously, I had been using a 1-1/2 inch diameter sanding drum when removing wood. Here, however, in order to localize the wood removal, I used a 1/2 inch diameter sanding drum. All told, I removed about 2.5 mm of wood resulting in a pretty deep “notch” at the bar center. Here is a photo of the final bar and the resulting frequencies.
To summarize, the fundamental frequency dropped by 20 cents, and the second partial stayed about the same (the change of 1 cent was smaller than the measurement precision). Remarkable – the math accurately predicted the physical behavior of the bars…again!
The following figures graphically demonstrate the effect of these two experiments.
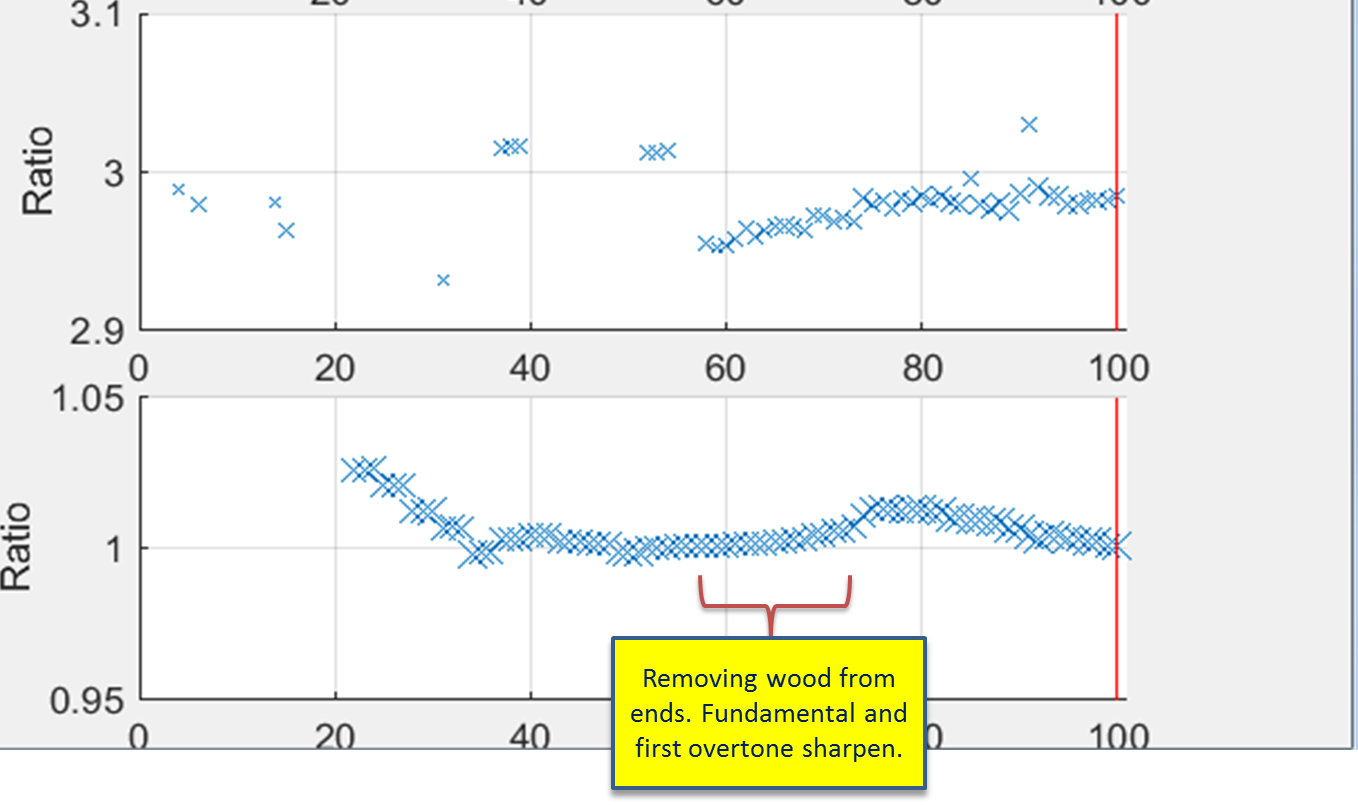
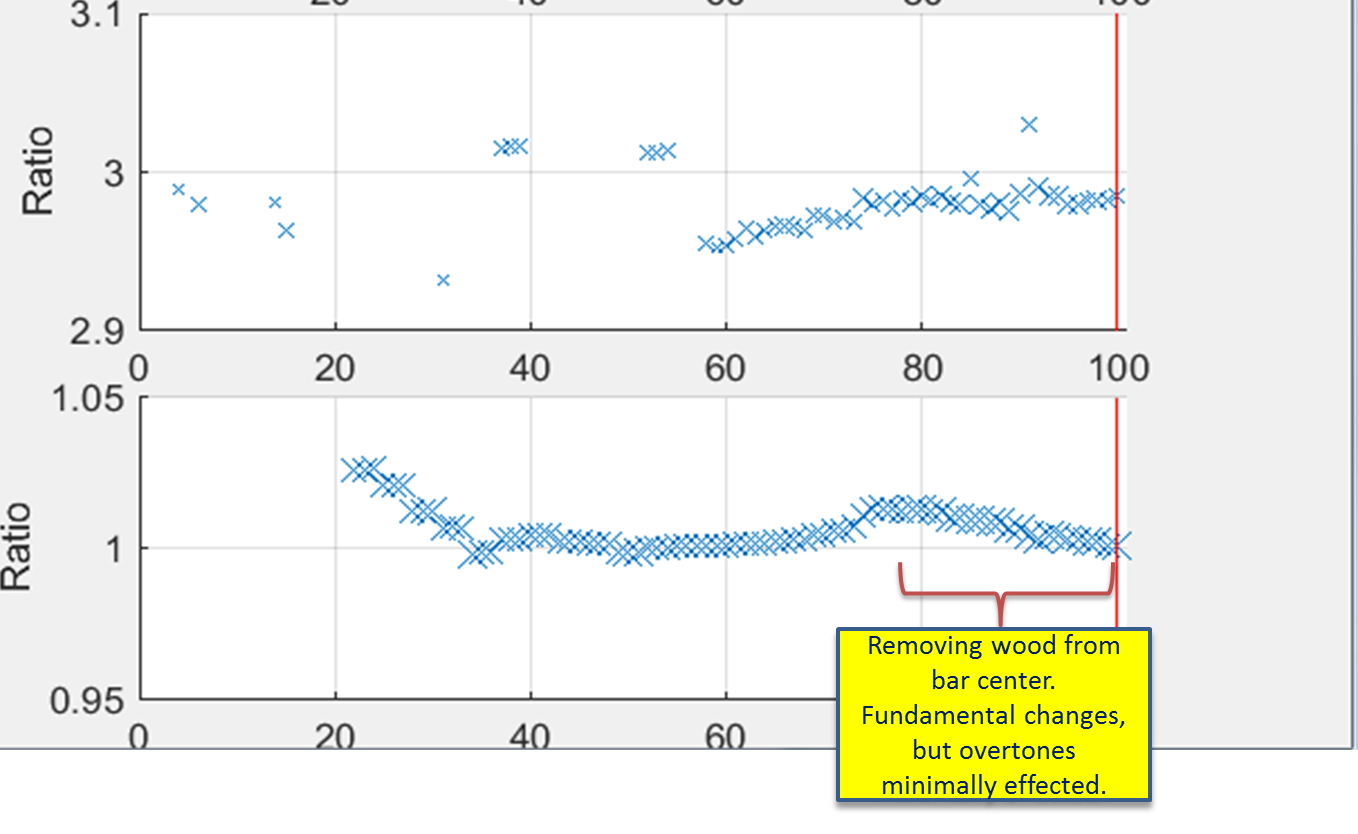
Each figure contains two graphs that plot frequency as a function of the spectral measurement number (i.e., in integer that increments each time I measure the frequencies on the tuning station). The top graph of each figure quantifies the frequency ratio for the second partial and the bottom contains the frequency ratio of the fundamental. Both ratios are relative to the desired frequency, which for this F4 bar is 350.8 Hz.
These plots qualitatively confirm the tuning curves predictions. For example, on the top figure, you can see that as I remove wood from the ends, both the fundamental and overtone frequencies increase. On the bottom figure, where wood is being removed form the center, you can see that only the fundamental gets flatter – the overtone stays more/less the same.