Jack and I were ready to go into production for our 44 Rosewood bars. All of the previous discussion about the maple bar is apropos here too, but I will fill in some details of the construction process.
Our First Two Bars
We made two bars first, the longest and the shortest, so that we could ensure that the math and process that we developed for our maple bar also worked for the Rosewood.
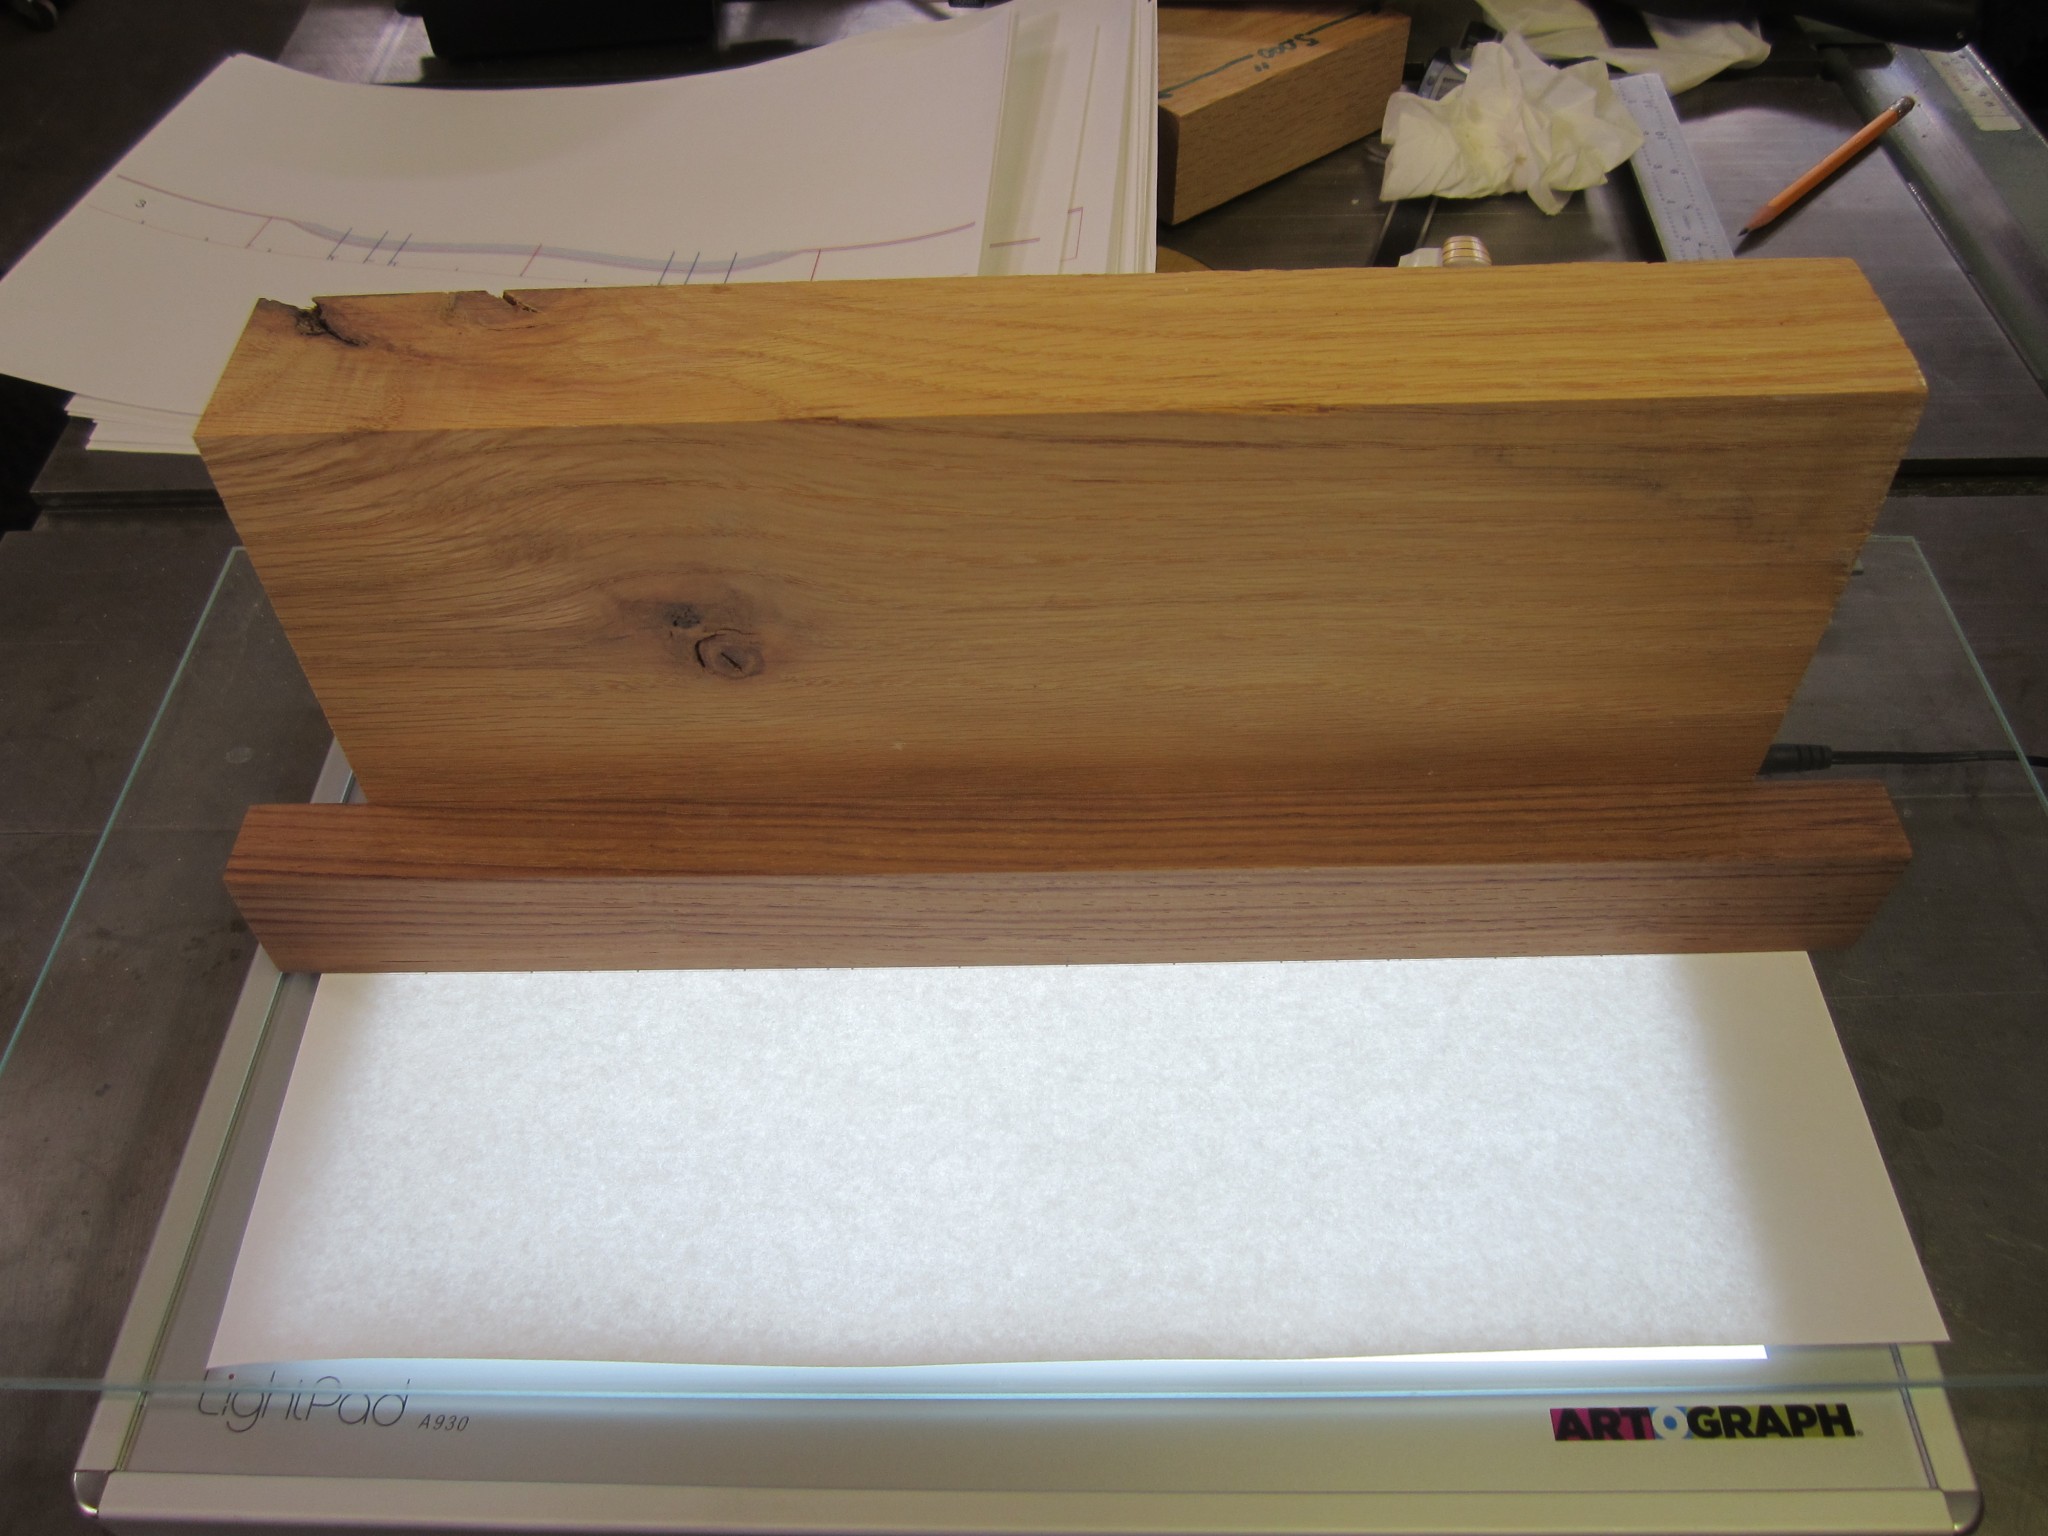
One part of the process that I didn’t show for the maple bar was adhering the paper template to the bar. It is pretty important that this be aligned accurately with the wood, so I developed a technique that used my daughter’s light table. This photo shows the configuration that I used.

The picture shows the light table with a piece of window glass on top to extend the flat surface of the table (since the longest bars were longer than the light table), and a large block of wood that we used to align the bar with the template. We sprayed the bar side with 3M adhesive to attach the template. If you’ve ever used this stuff, you know that you only get one chance to align the two pieces – there are no do-overs. So we would put the paper template on the glass face down and then carefully align the wood block to the top edge of the bar profile printed on the paper. We penciled a small center mark on the bar that allowed us to ensure that we had good left/right centering. Then, with adhesive on the bar edge, we would carefully slide the bar down the alignment block, while taking care to align the center marks on the bar and the template. Here is a photo of the bar correctly aligned to the template:
There is not much to see in this photo, because the bar completely covers the printed lines on the paper. Paper was stuck to the bar, we would use a sharp razor to trip the paper flush with the bar. Here is a photo that Jack took of me trimming the template:

Blanks and Templates
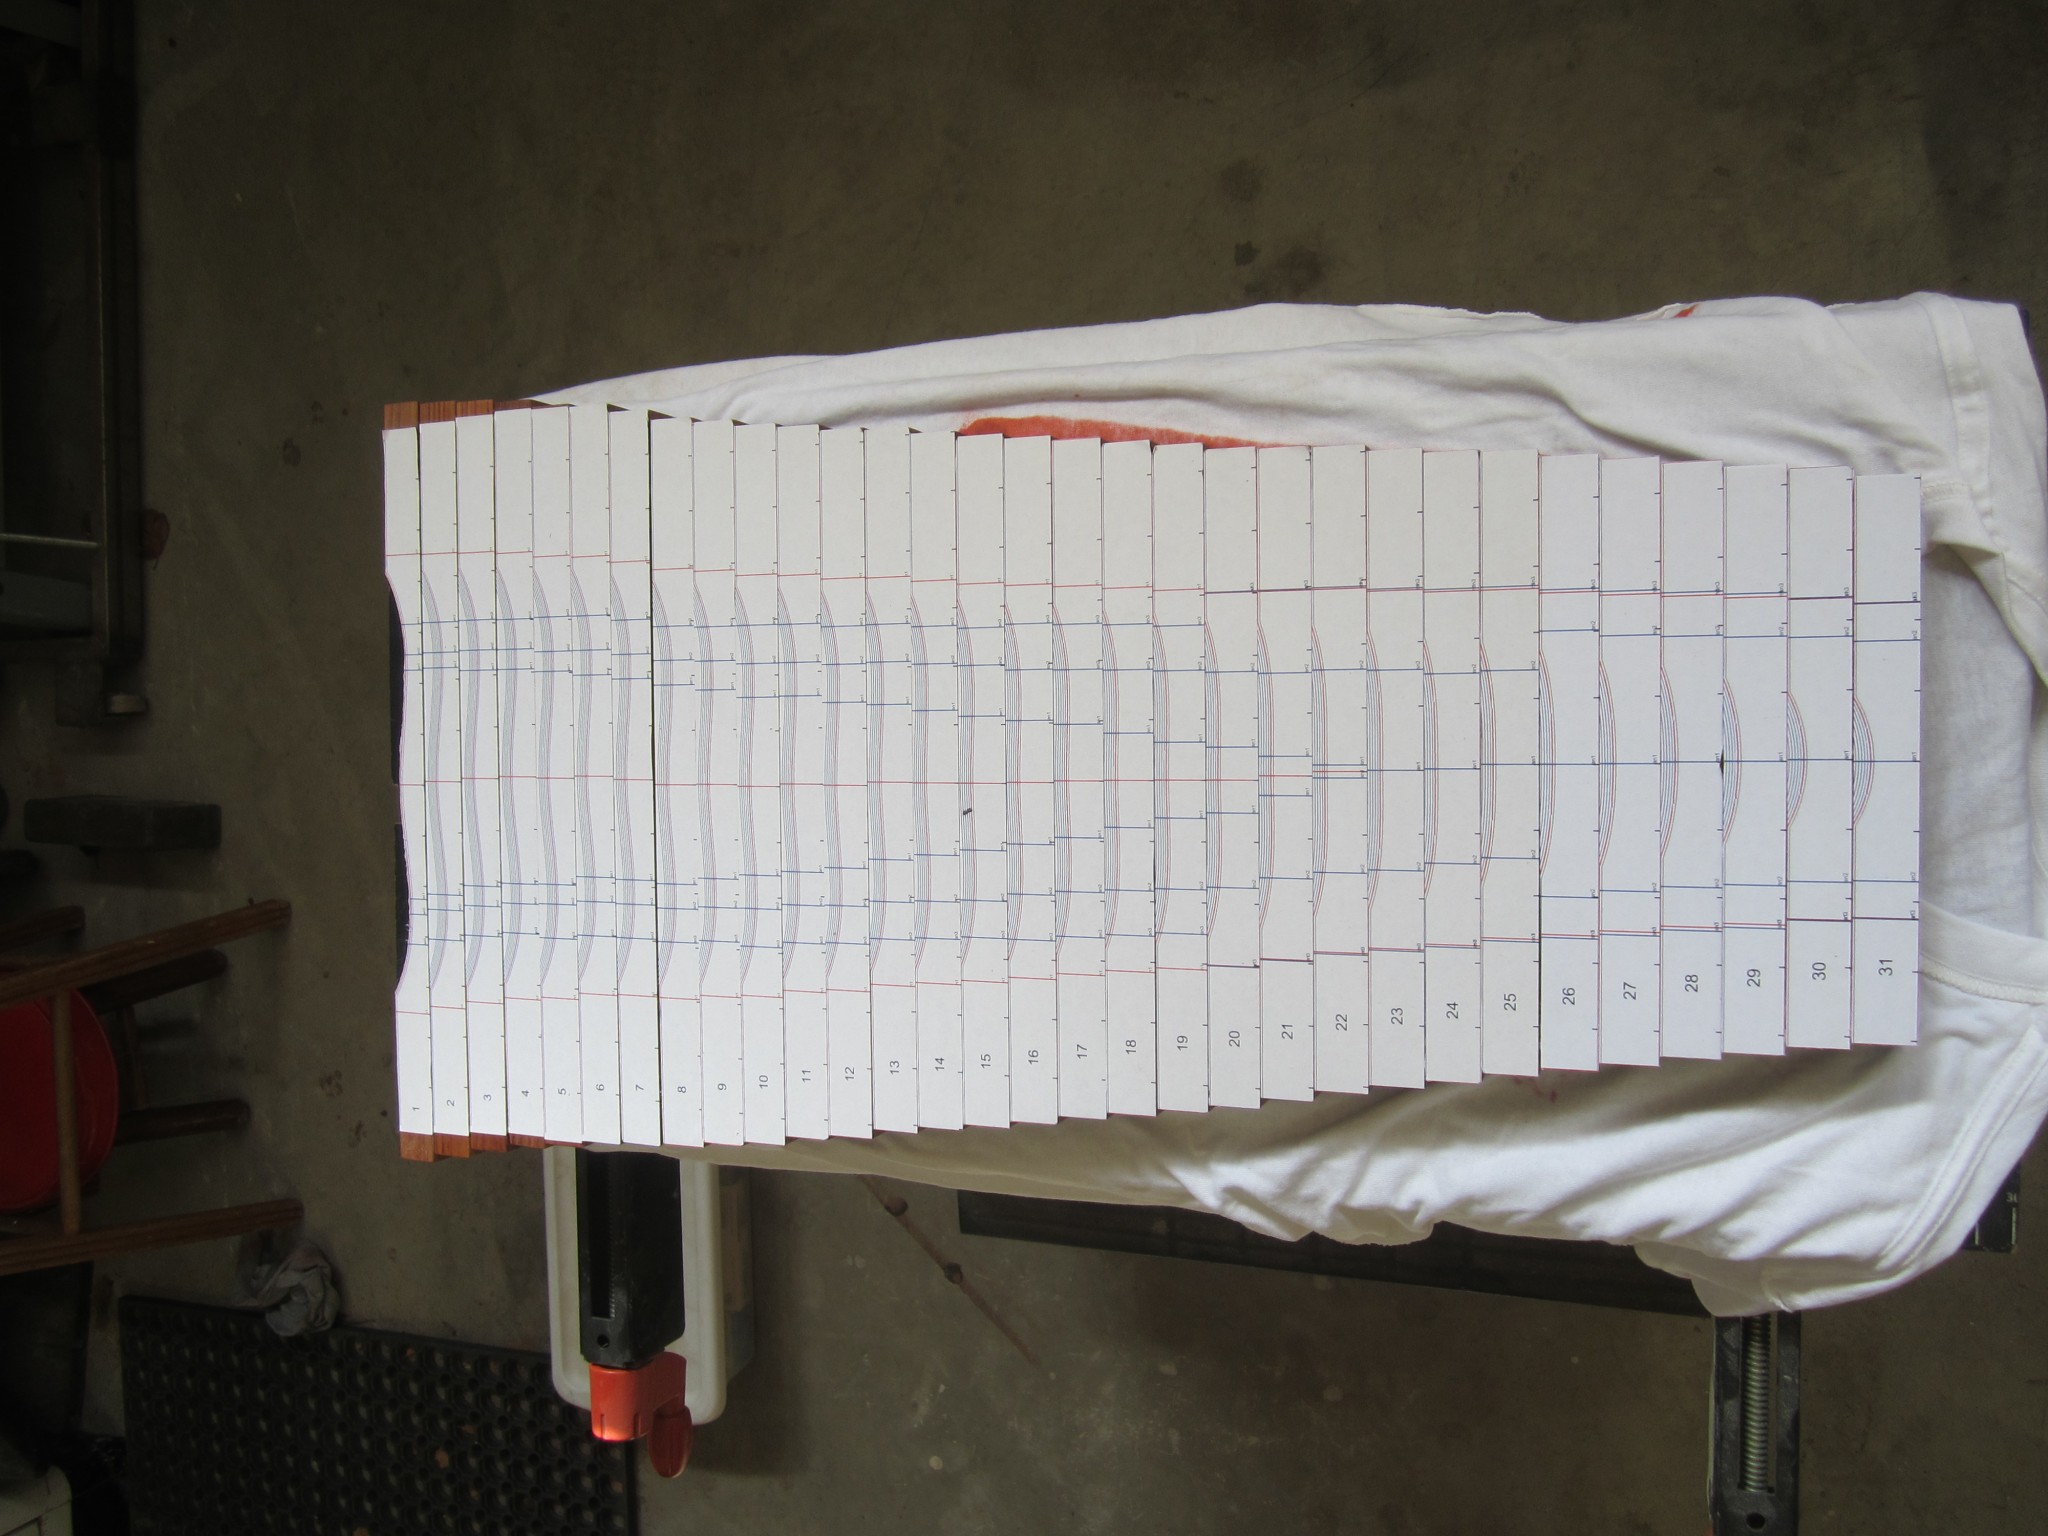
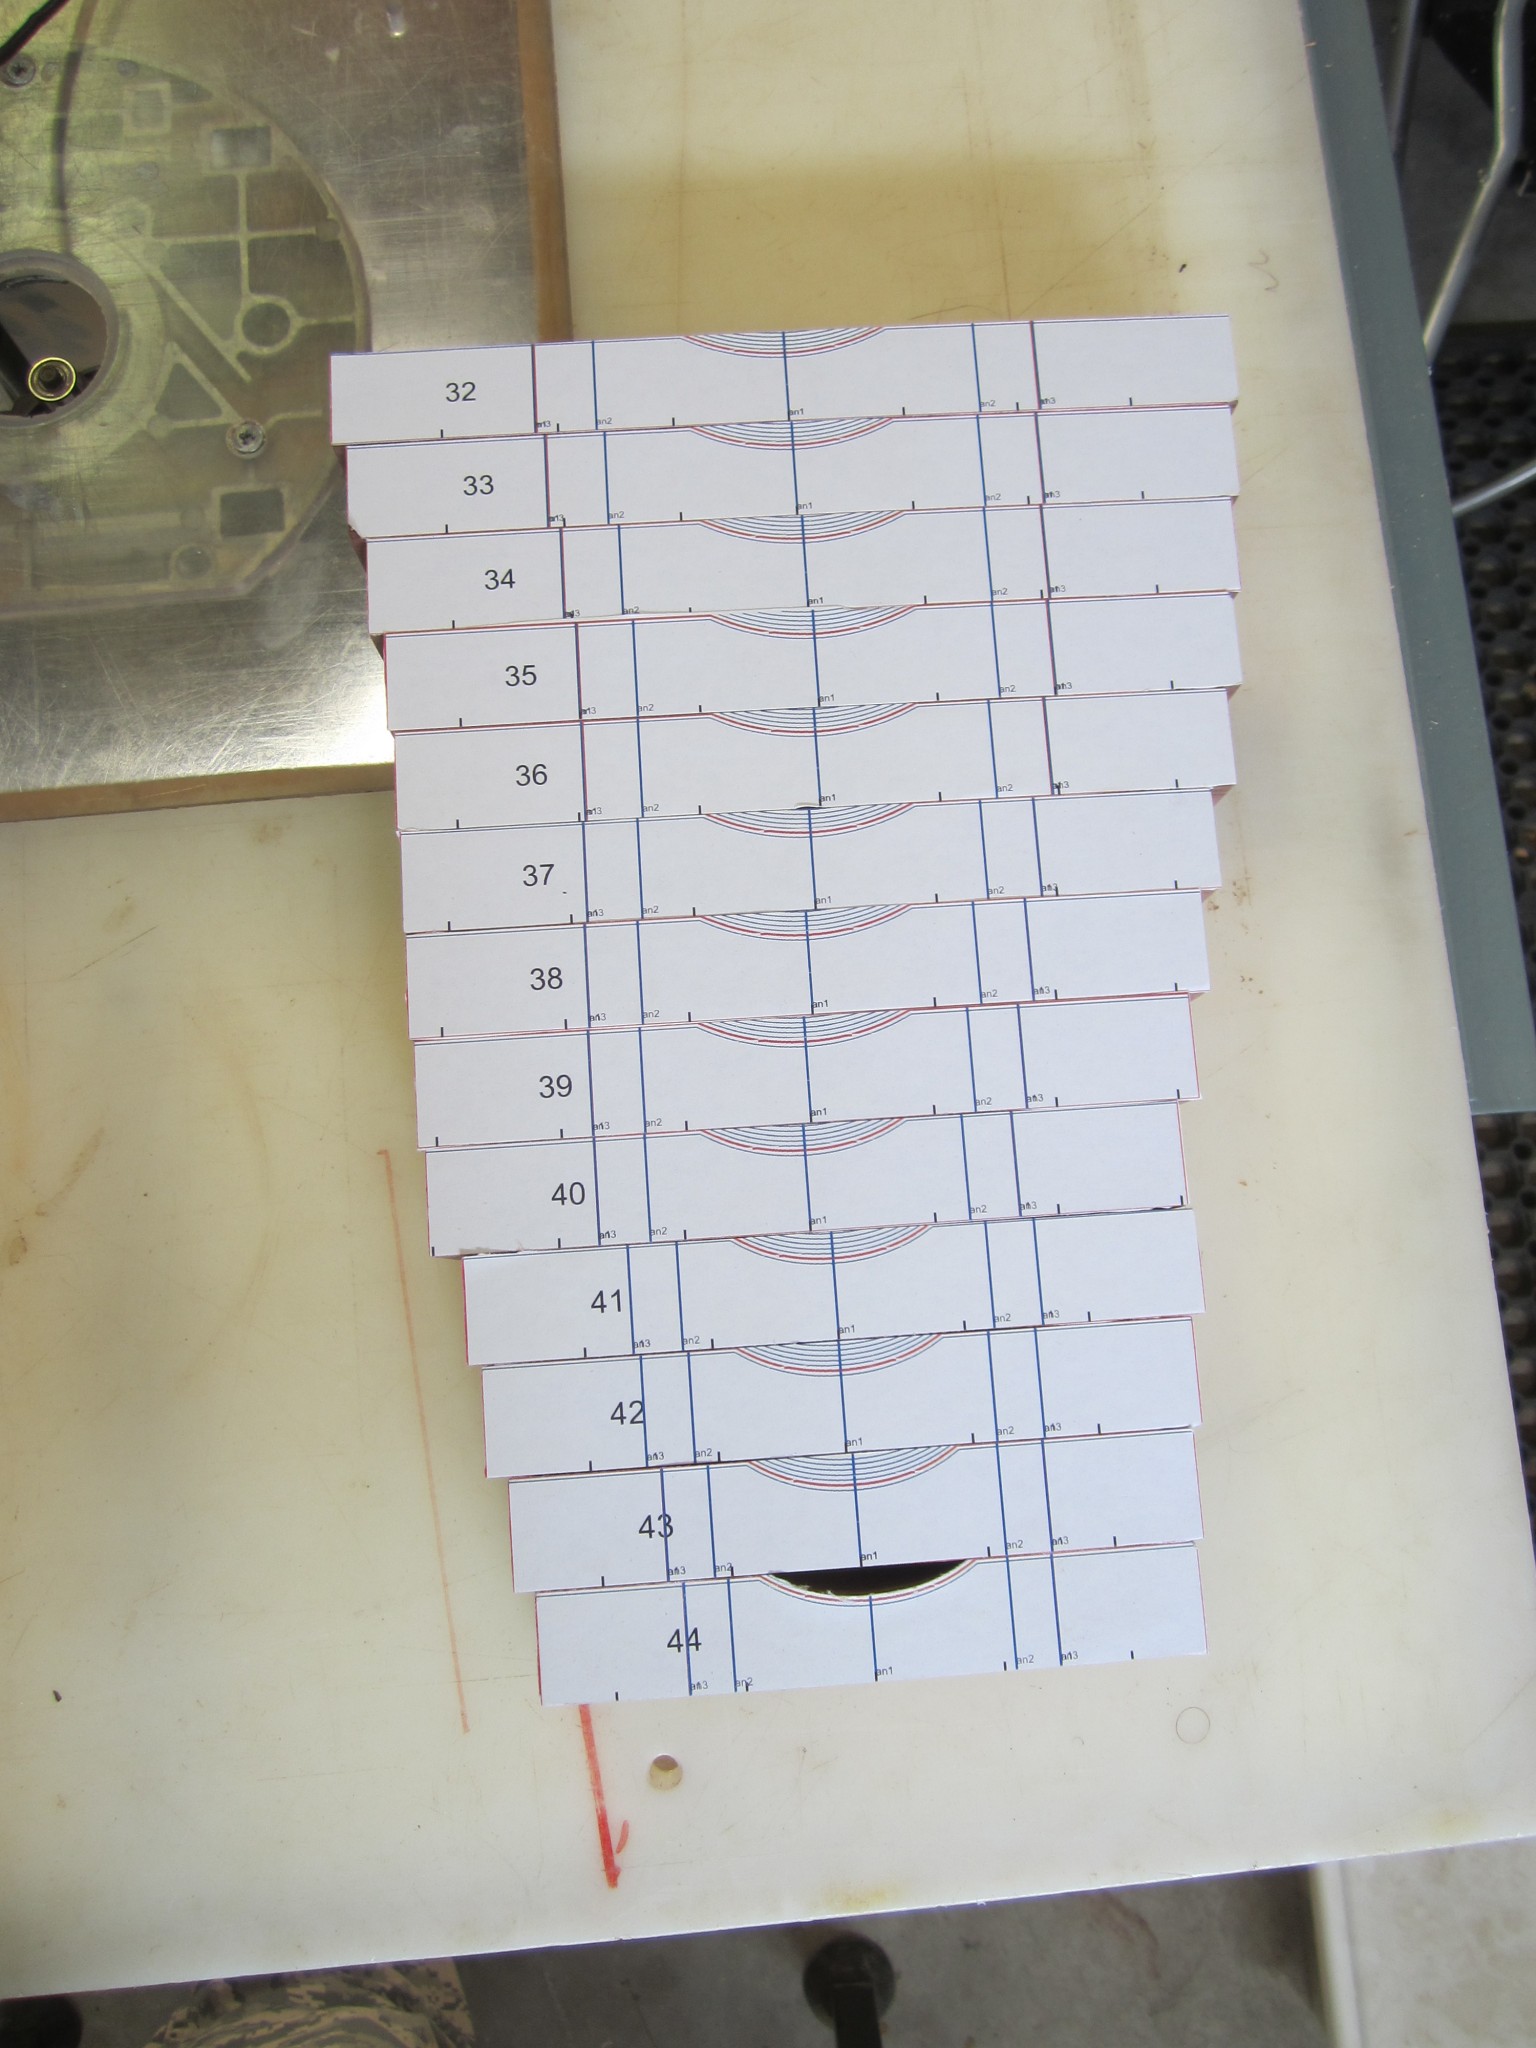
To say the least, attaching all of the paper templates is a bit tedious, but works well. Here are a couple of photos of the 42 “blank” bars with the templates attached (2 were already shaped as described below).
After attaching the templates, the first thing I did was spectrally measure each of the bars to establish a baseline. This is when I discovered that three of the bars were spectral outliers. The following figure details this finding:
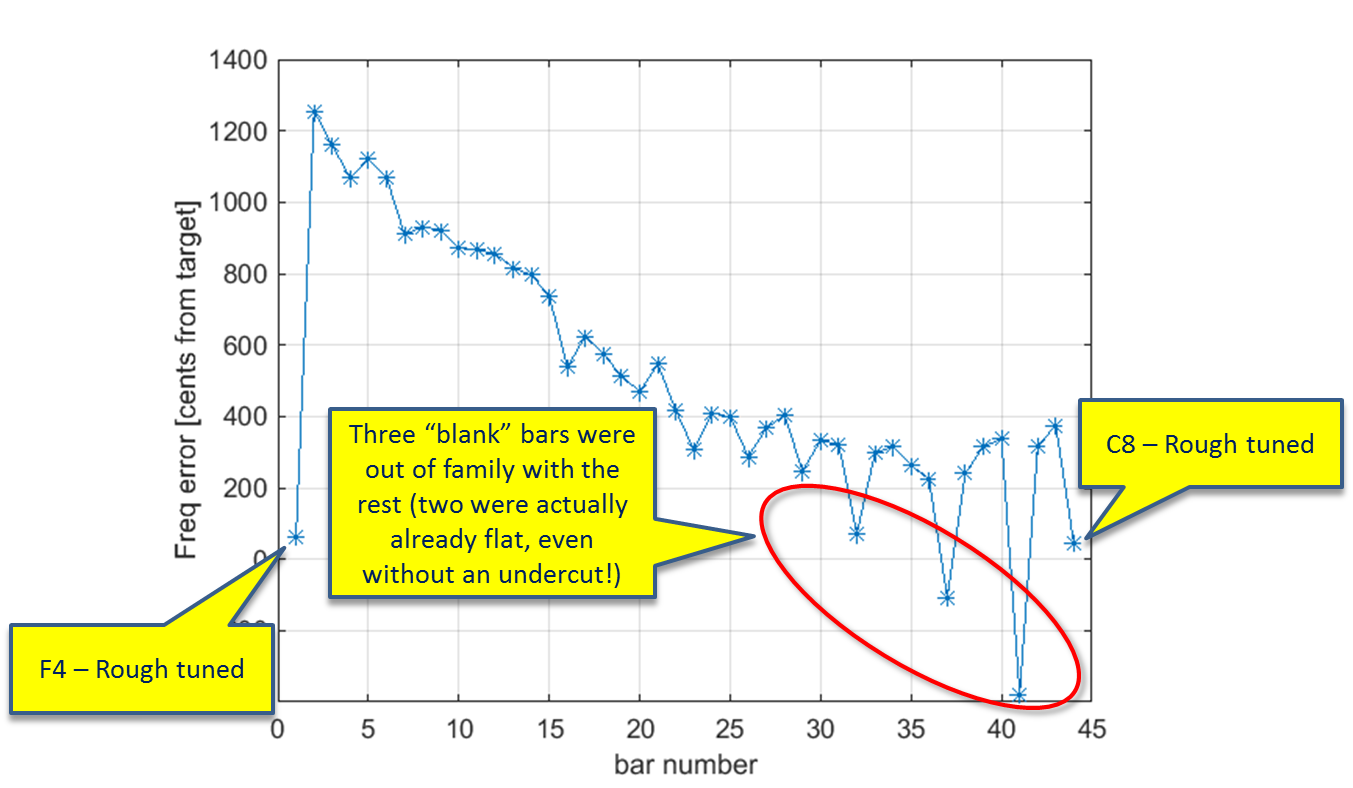
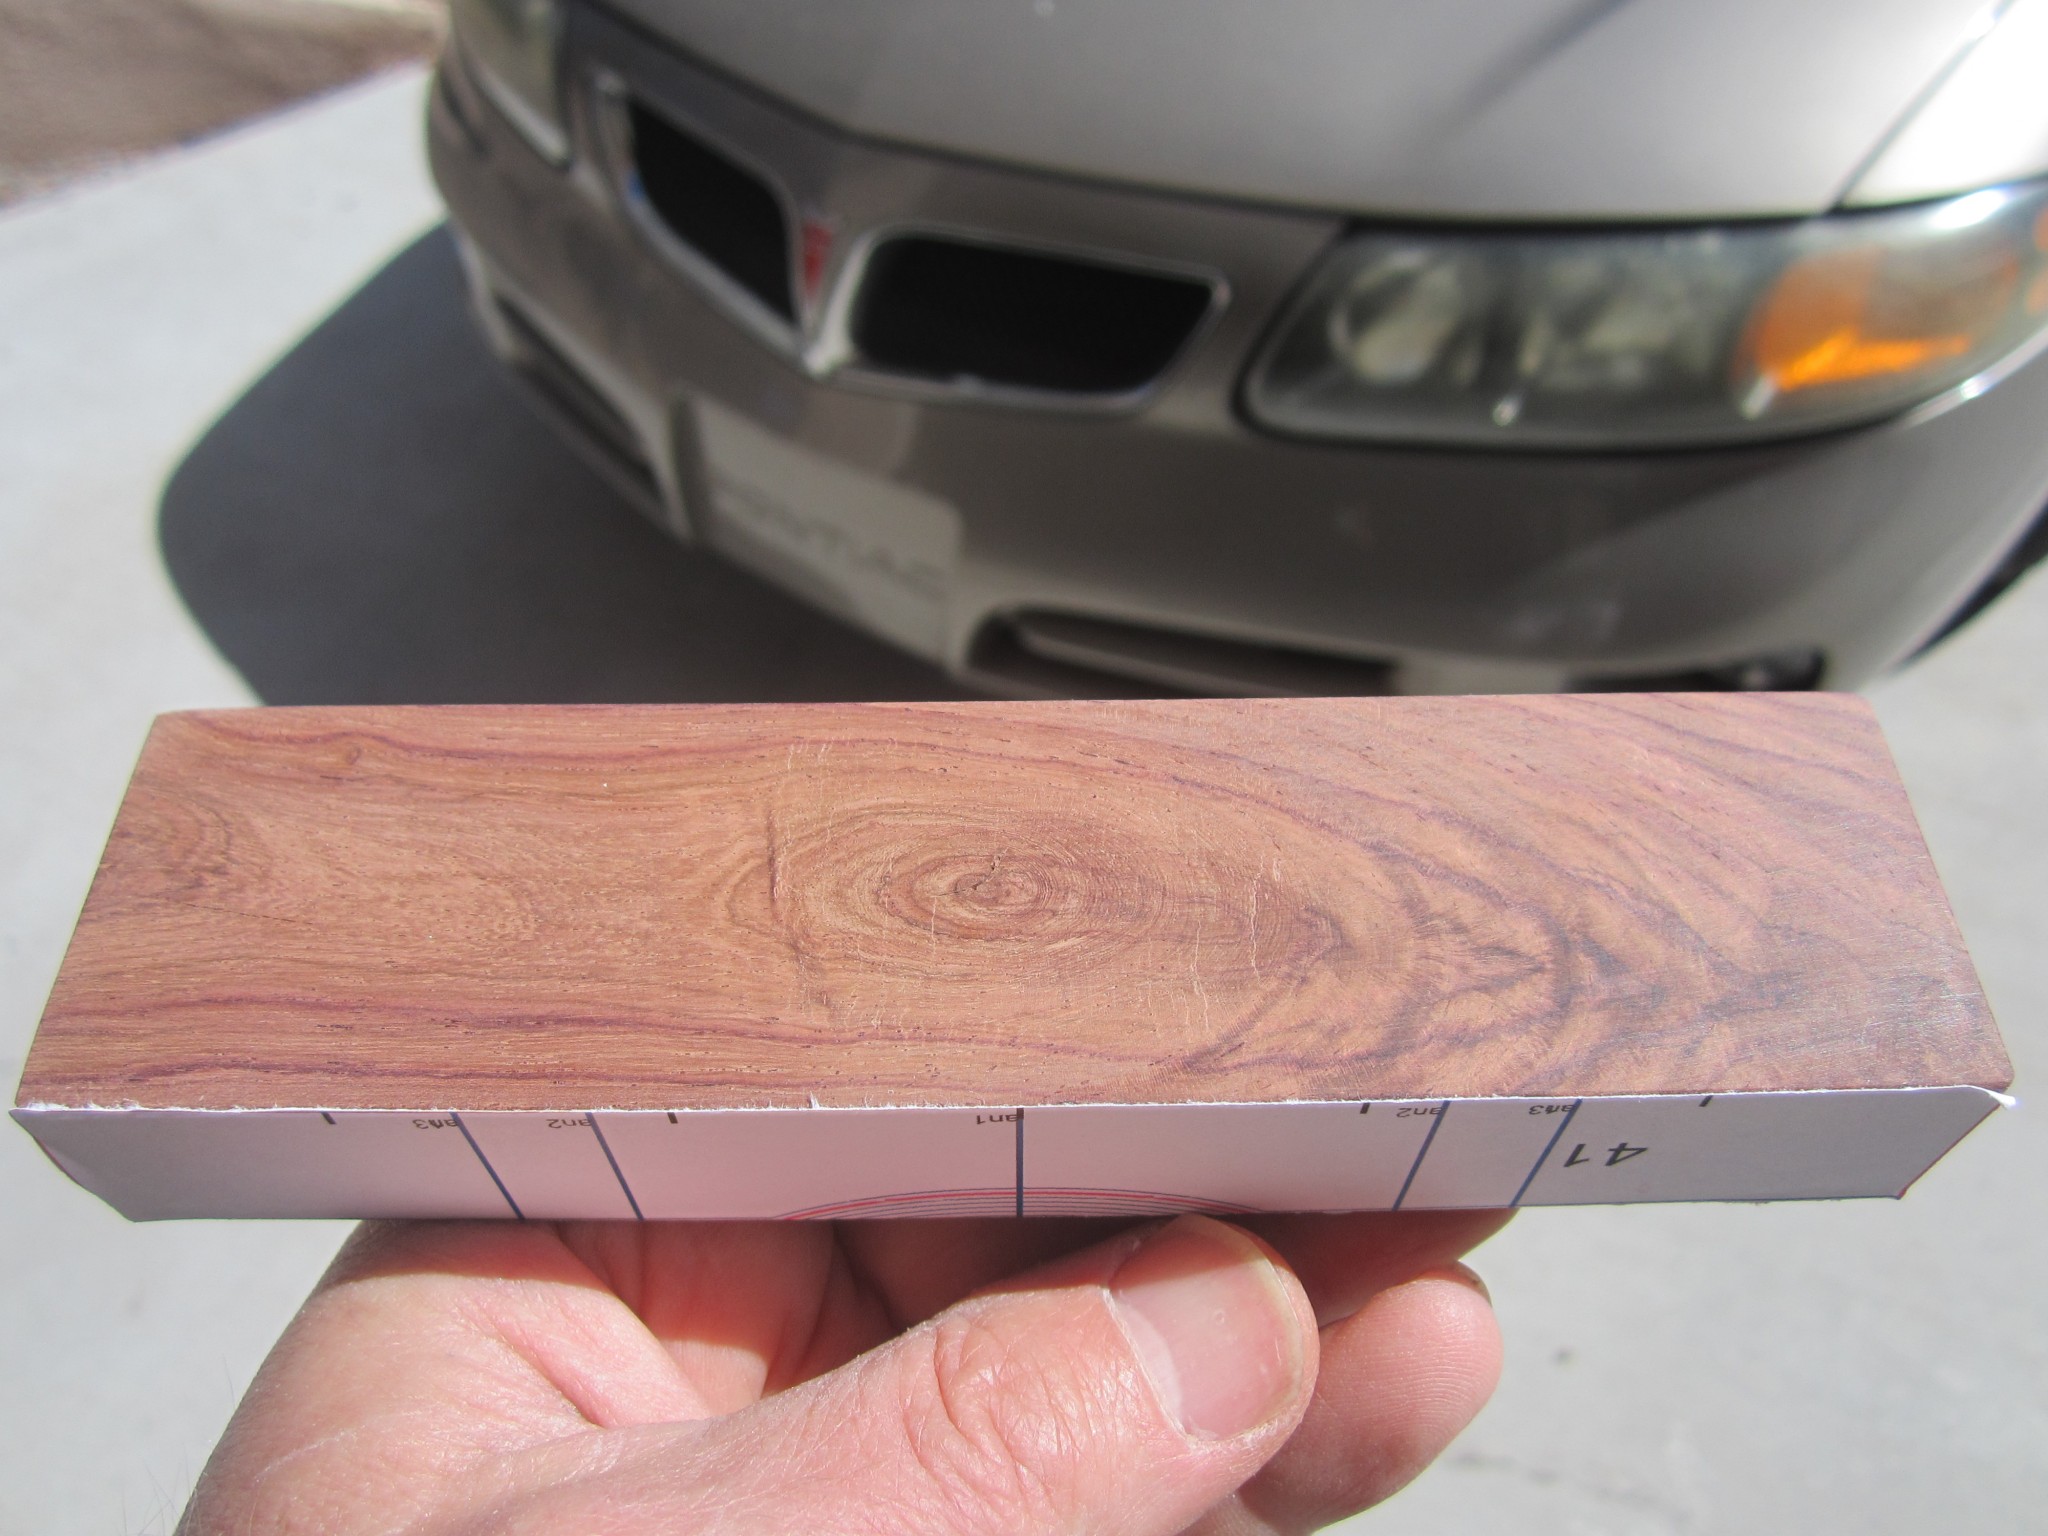
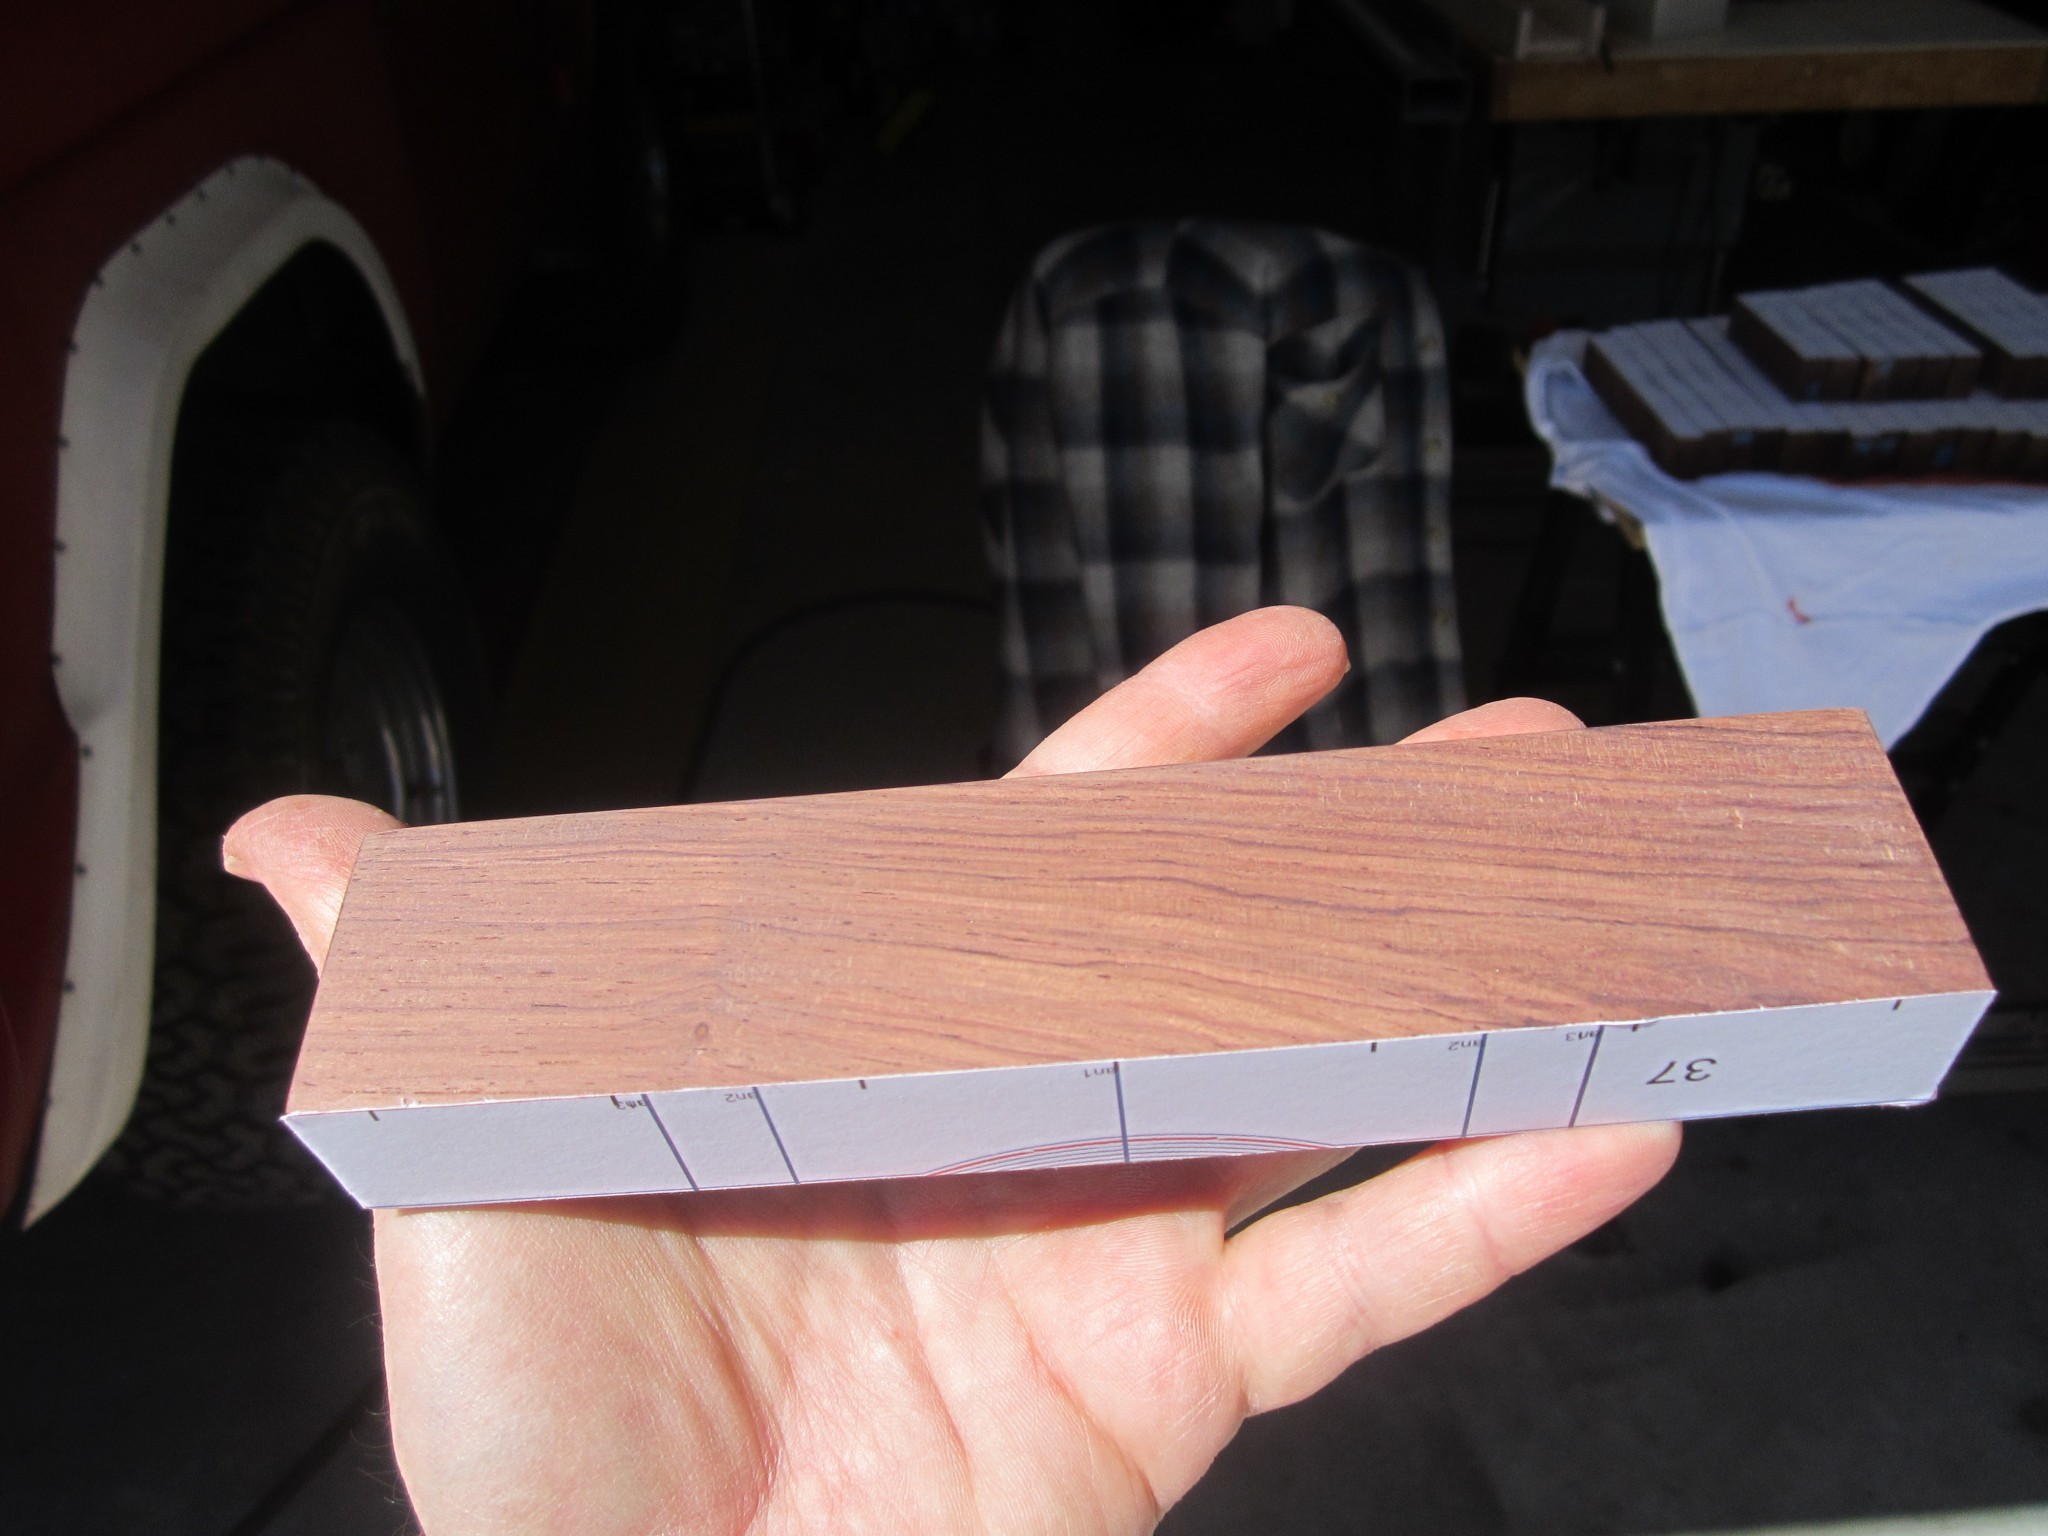
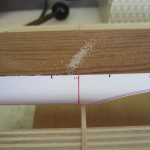
This figure plots the error in the fundamental mode (quantified in cents, relative to the desired target frequency). The first and last points corresponded to my F4 and C8 bars which we had previously “rough tuned.” The three bars inscribed by the ellipse are the outliers. Notice that these are “out of family” relative to the rest. Two of the three were actually already flat (relative to the target frequency). For one of the bars (#41) I anticipated there might be a problem, as it had a knot in the center. Here is a picture of that bar:
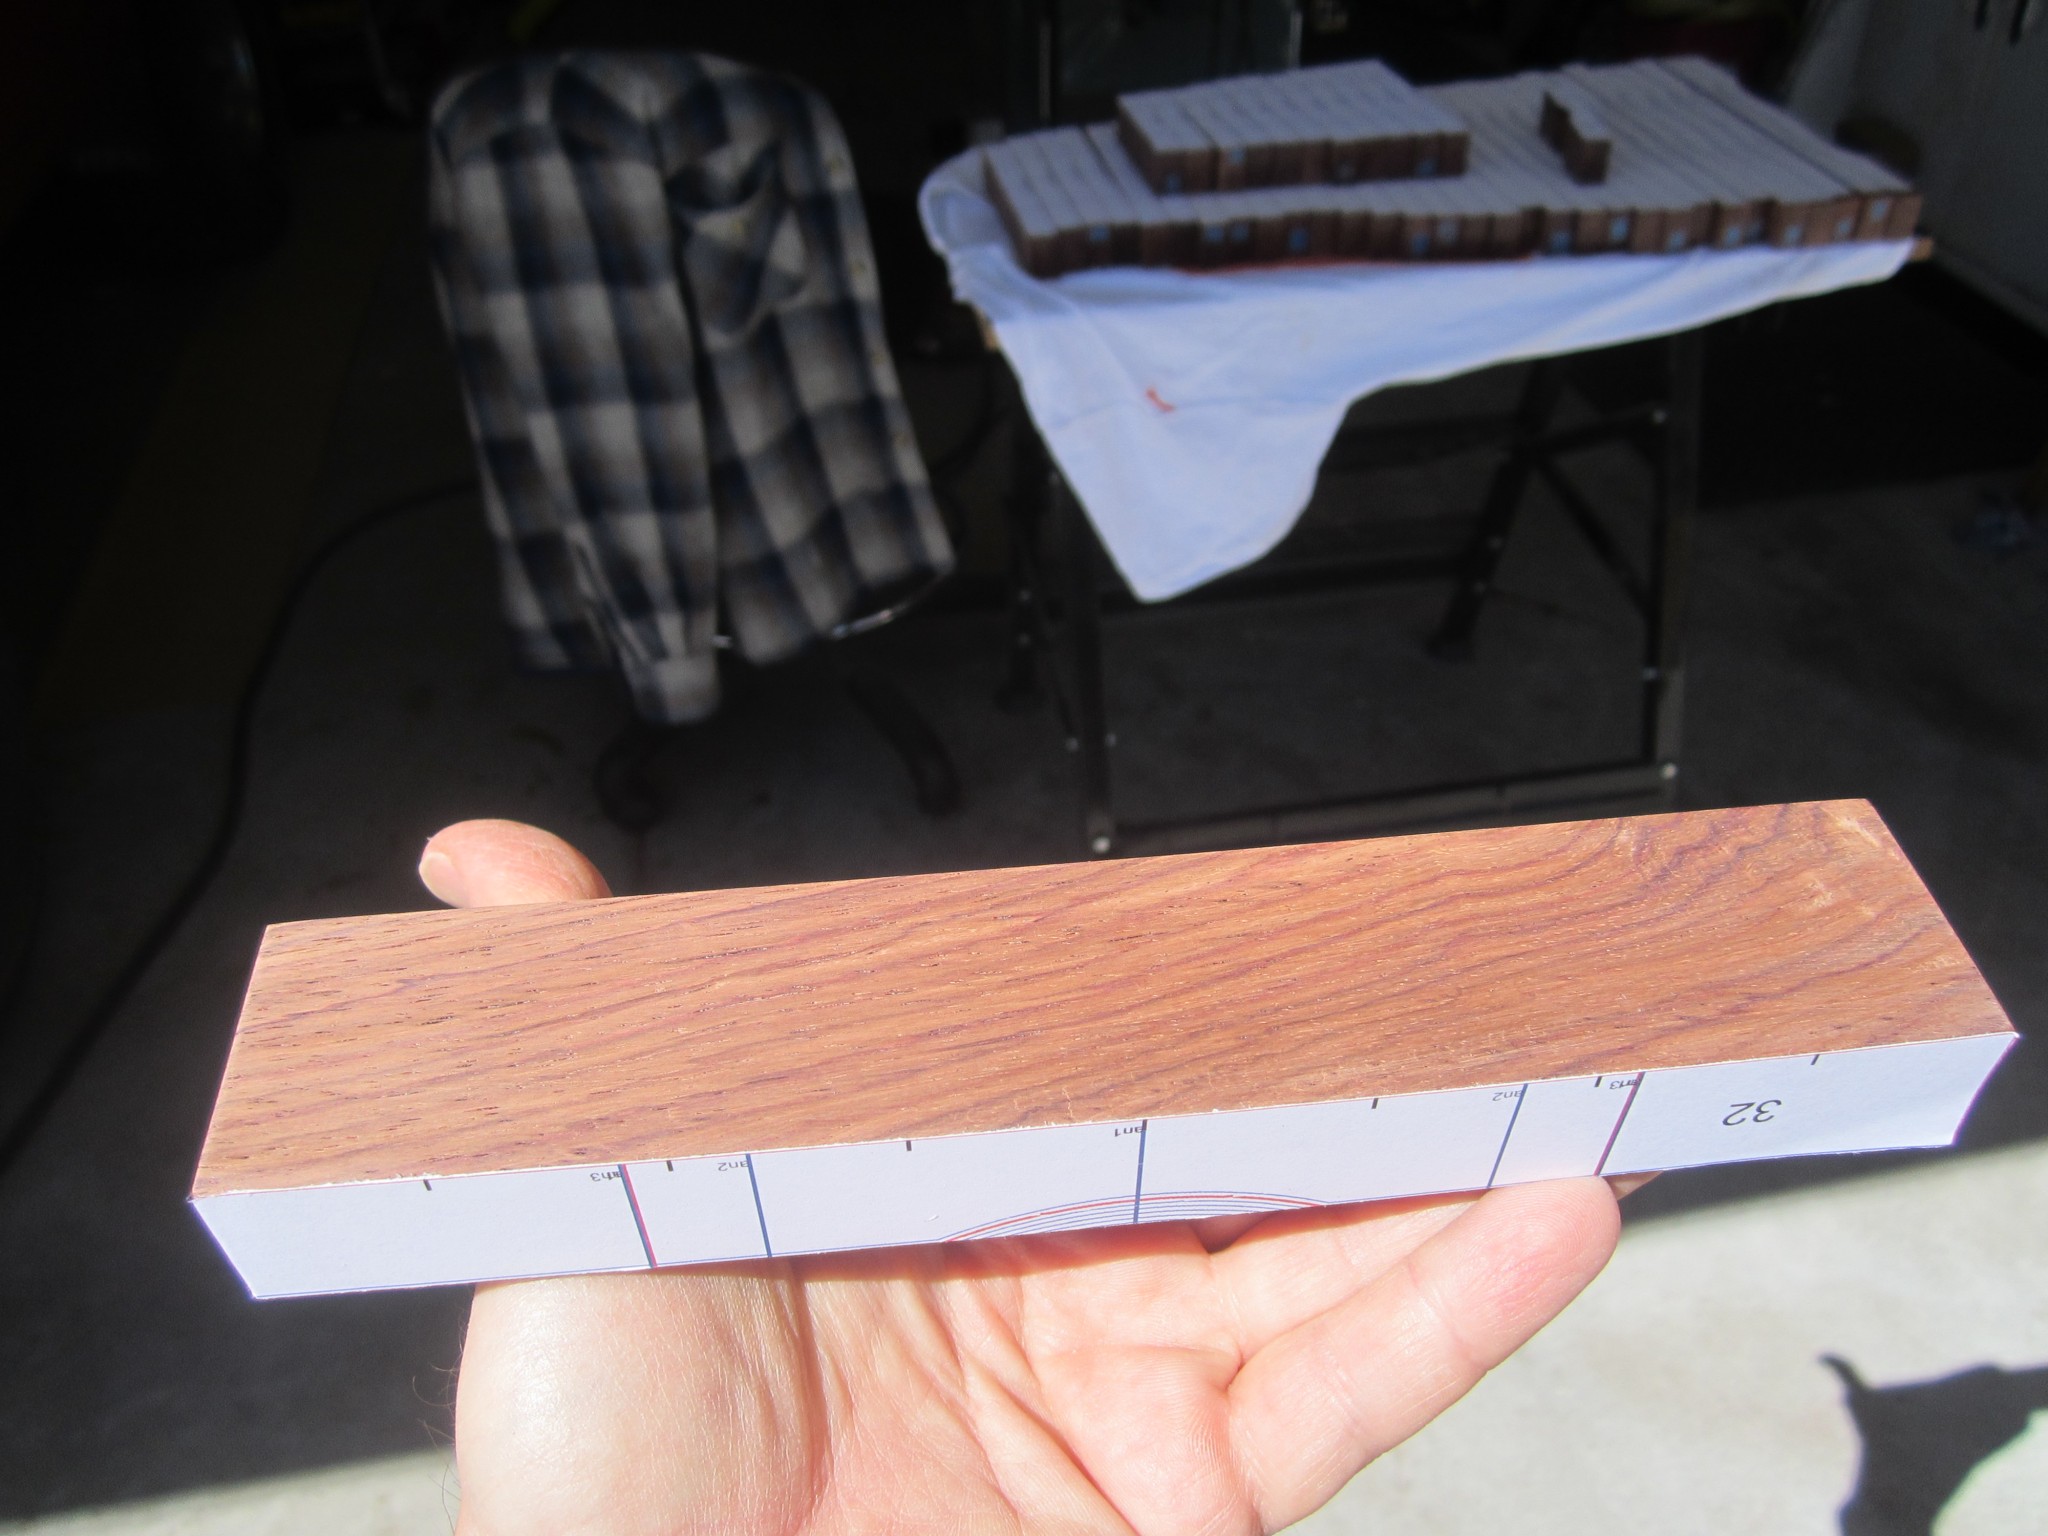
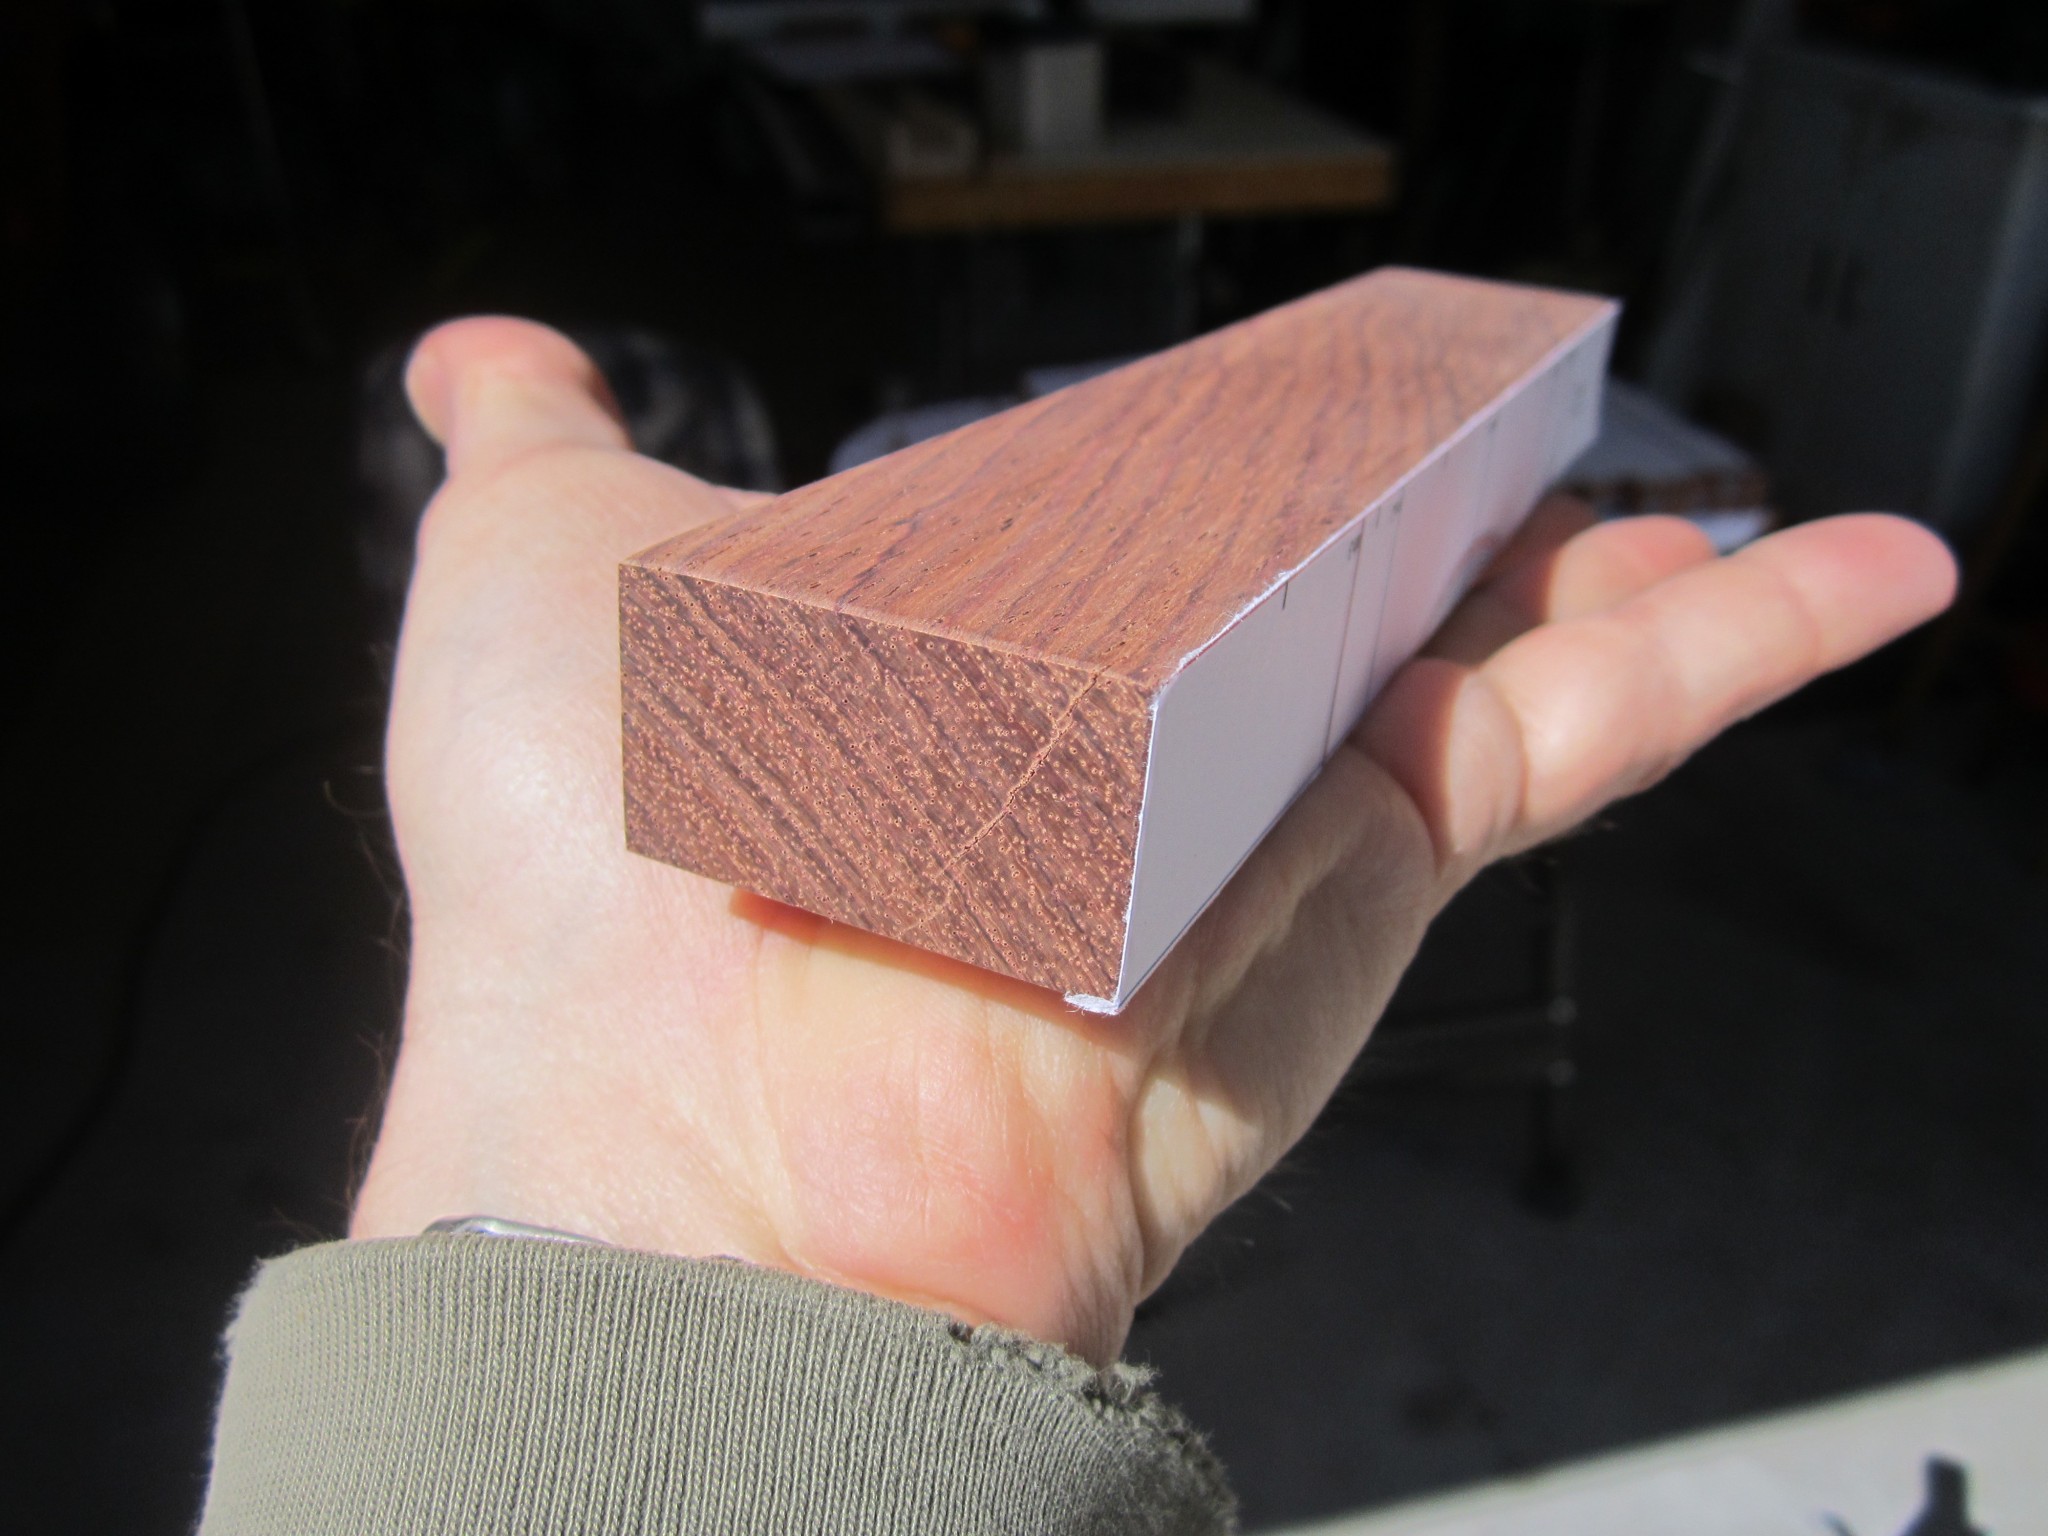
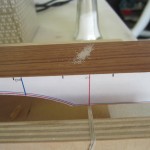
Of the other two, one had some slight checking in the end which may have been indicative of a more systematic issue with that chunk of wood. I could find no issue at all with the third bar. Perhaps it had some internal flaw. Here are some photos of those two bars:
In order to determine if perhaps the unusual sonic results for these three bars might be related to density, I weighted each bar and computed the density. The tabulated density values are in the Excel file included in the previous post and are plotted here.
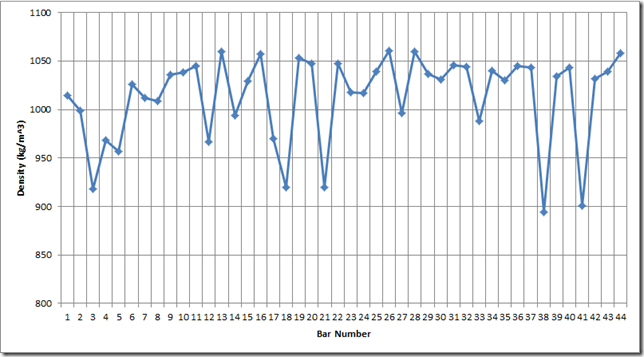
While the density of bar 41 looks way low, the densities for the other two anomalous bars look “in family” with the rest of the measurements. Further, there are other bars, like 18 and 21 that have low densities but in-family sonic characteristics; so it does not appear that the unusual behavior is related to density variation. As a side note, I wish that I had kept track of which bars came from which boards; I suspect that the bars with low densities all came from the same board.
I ended up making three new bars to replace these funky bars. Luckily, I purchased some extra rosewood – throughout my woodworking forays, I have learned that I consistently underestimate the amount of waste that results during construction and have gotten better at compensating.
In any case, there was a fundamental lesson in this finding: to save effort, it would be wise to do a spectral analysis of each bar just after dimensioning the blanks in order to identify outliers. In my case, I wasted a bit of time sanding the bar surface smooth and attaching the labels prior to measuring the frequencies.
Shaping the Wood
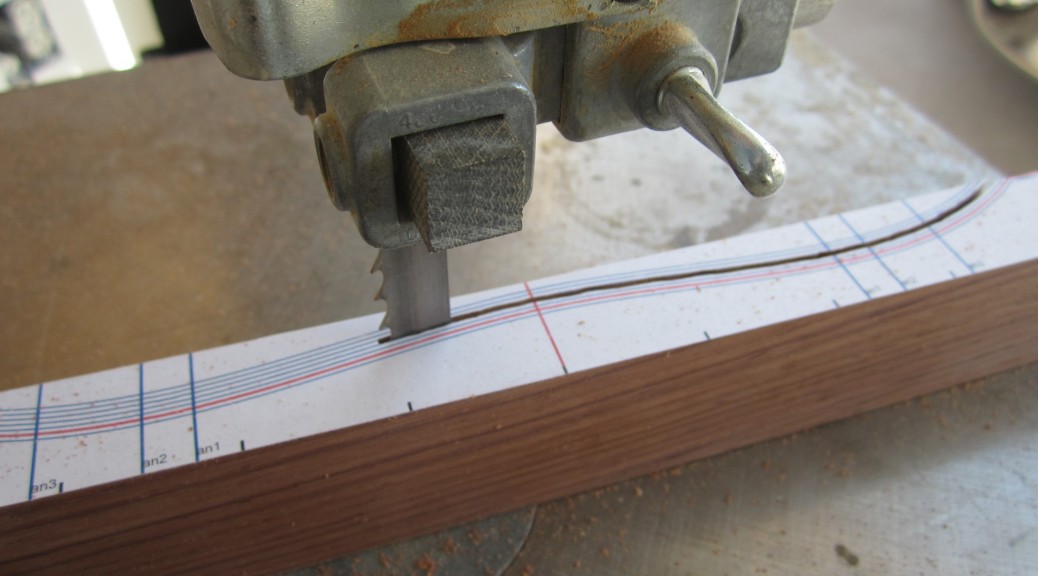
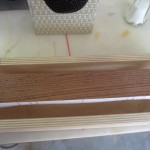
At the top of this post is a photo of the first band saw cut for our rosewood F4 bar – the longest bar.
Like the maple bar, I sanded a bit proud of the computer generated red bar profile line. Here is a photo of us sanding the bar:
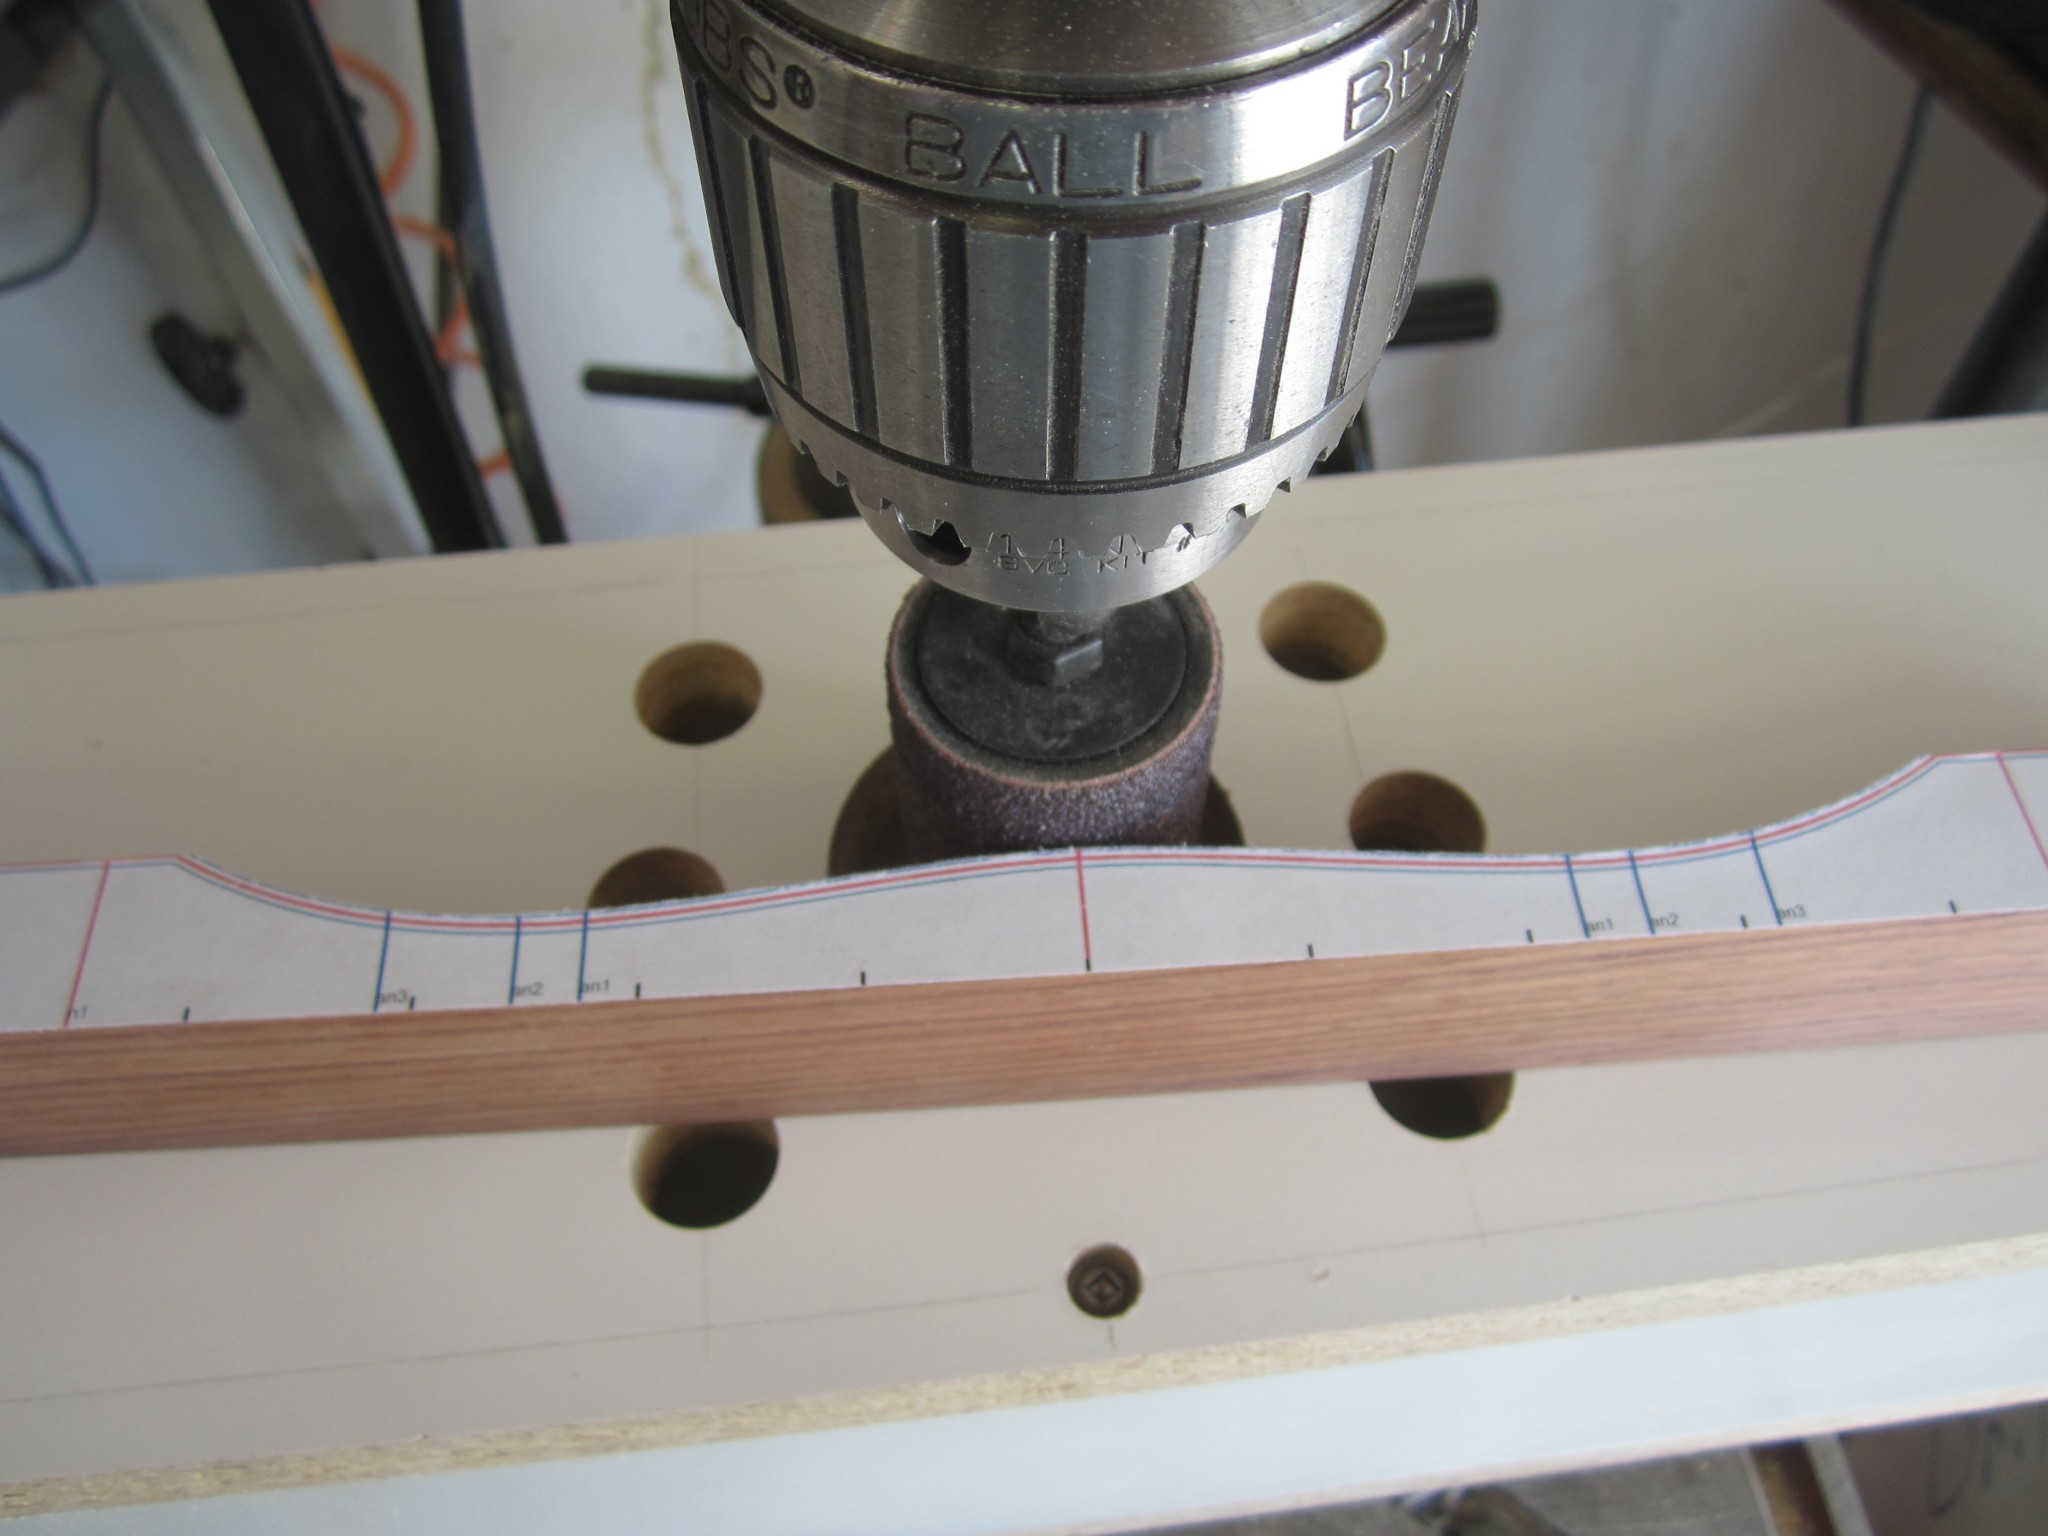
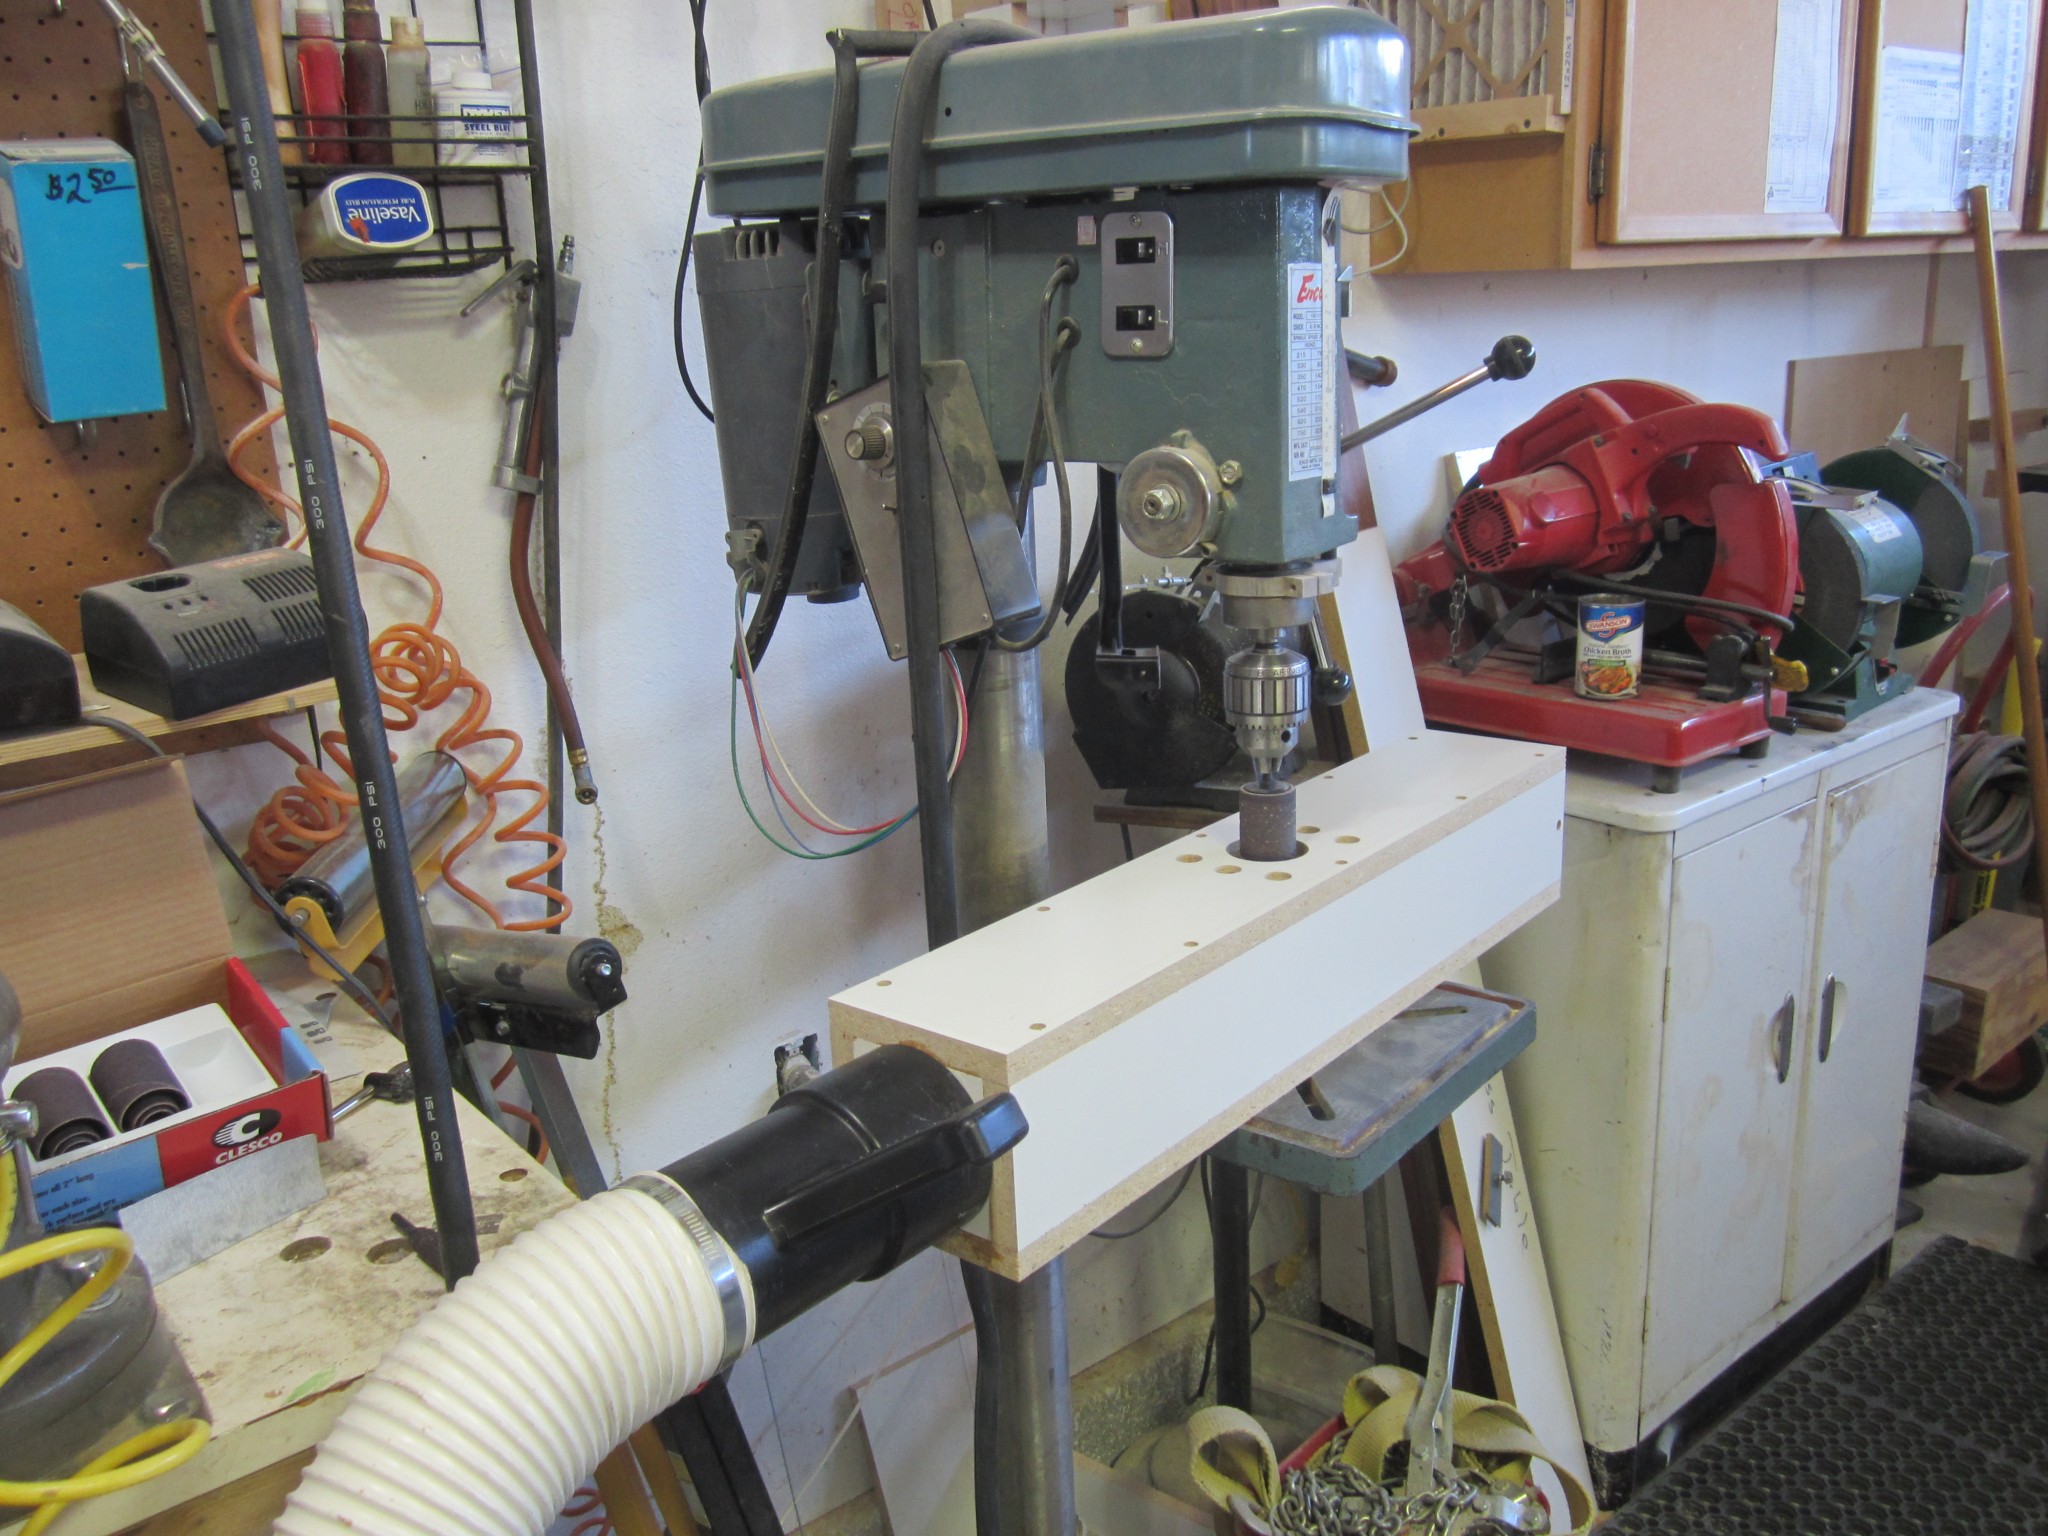
This is just a 2 inch drum on my drill press. The white base with the holes is a melamine box that I built to collect dust. This sanding produces a lot of rosewood dust which can cause allergic reactions in some people, so I wanted to capture as much of it as I could. Also, sucking the dust away as we sanded allowed us to more easily see the paper template lines. Here is a full picture of the box:
I left the bar about 50 cents sharp, which was a fraction of a millimeter above the computer prediction line. Out of curiosity, I did the “salt test” on this bar to see verify the node locations. Here is a picture:
You can see that the salt locations match very well with the predictions from the code – super cool!
We cut and tuned the shortest bar, which is a C8, by sanding to about 1 mm proud of the shape line predicted by the Timoshenko code. In this case, I was only about 36 cents sharp. In general, the assumptions underlying the beam theory break down for these shorter bars, so the computer predictions get worse. Dr Entwistle pointed me to a good paper by Oyadiji that described the use of 3-D Finite Element (FE) modeling and “plate theory” (as opposed to “beam theory”) to predict the modal behavior. However, as I have stated, I was not too concerned about tuning the overtones for the higher bars since they are negligibly affect the timbre. I just needed the code to predict shapes that got me in the ballpark since the final tuning is iterative anyway.
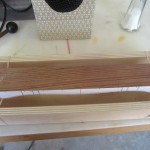
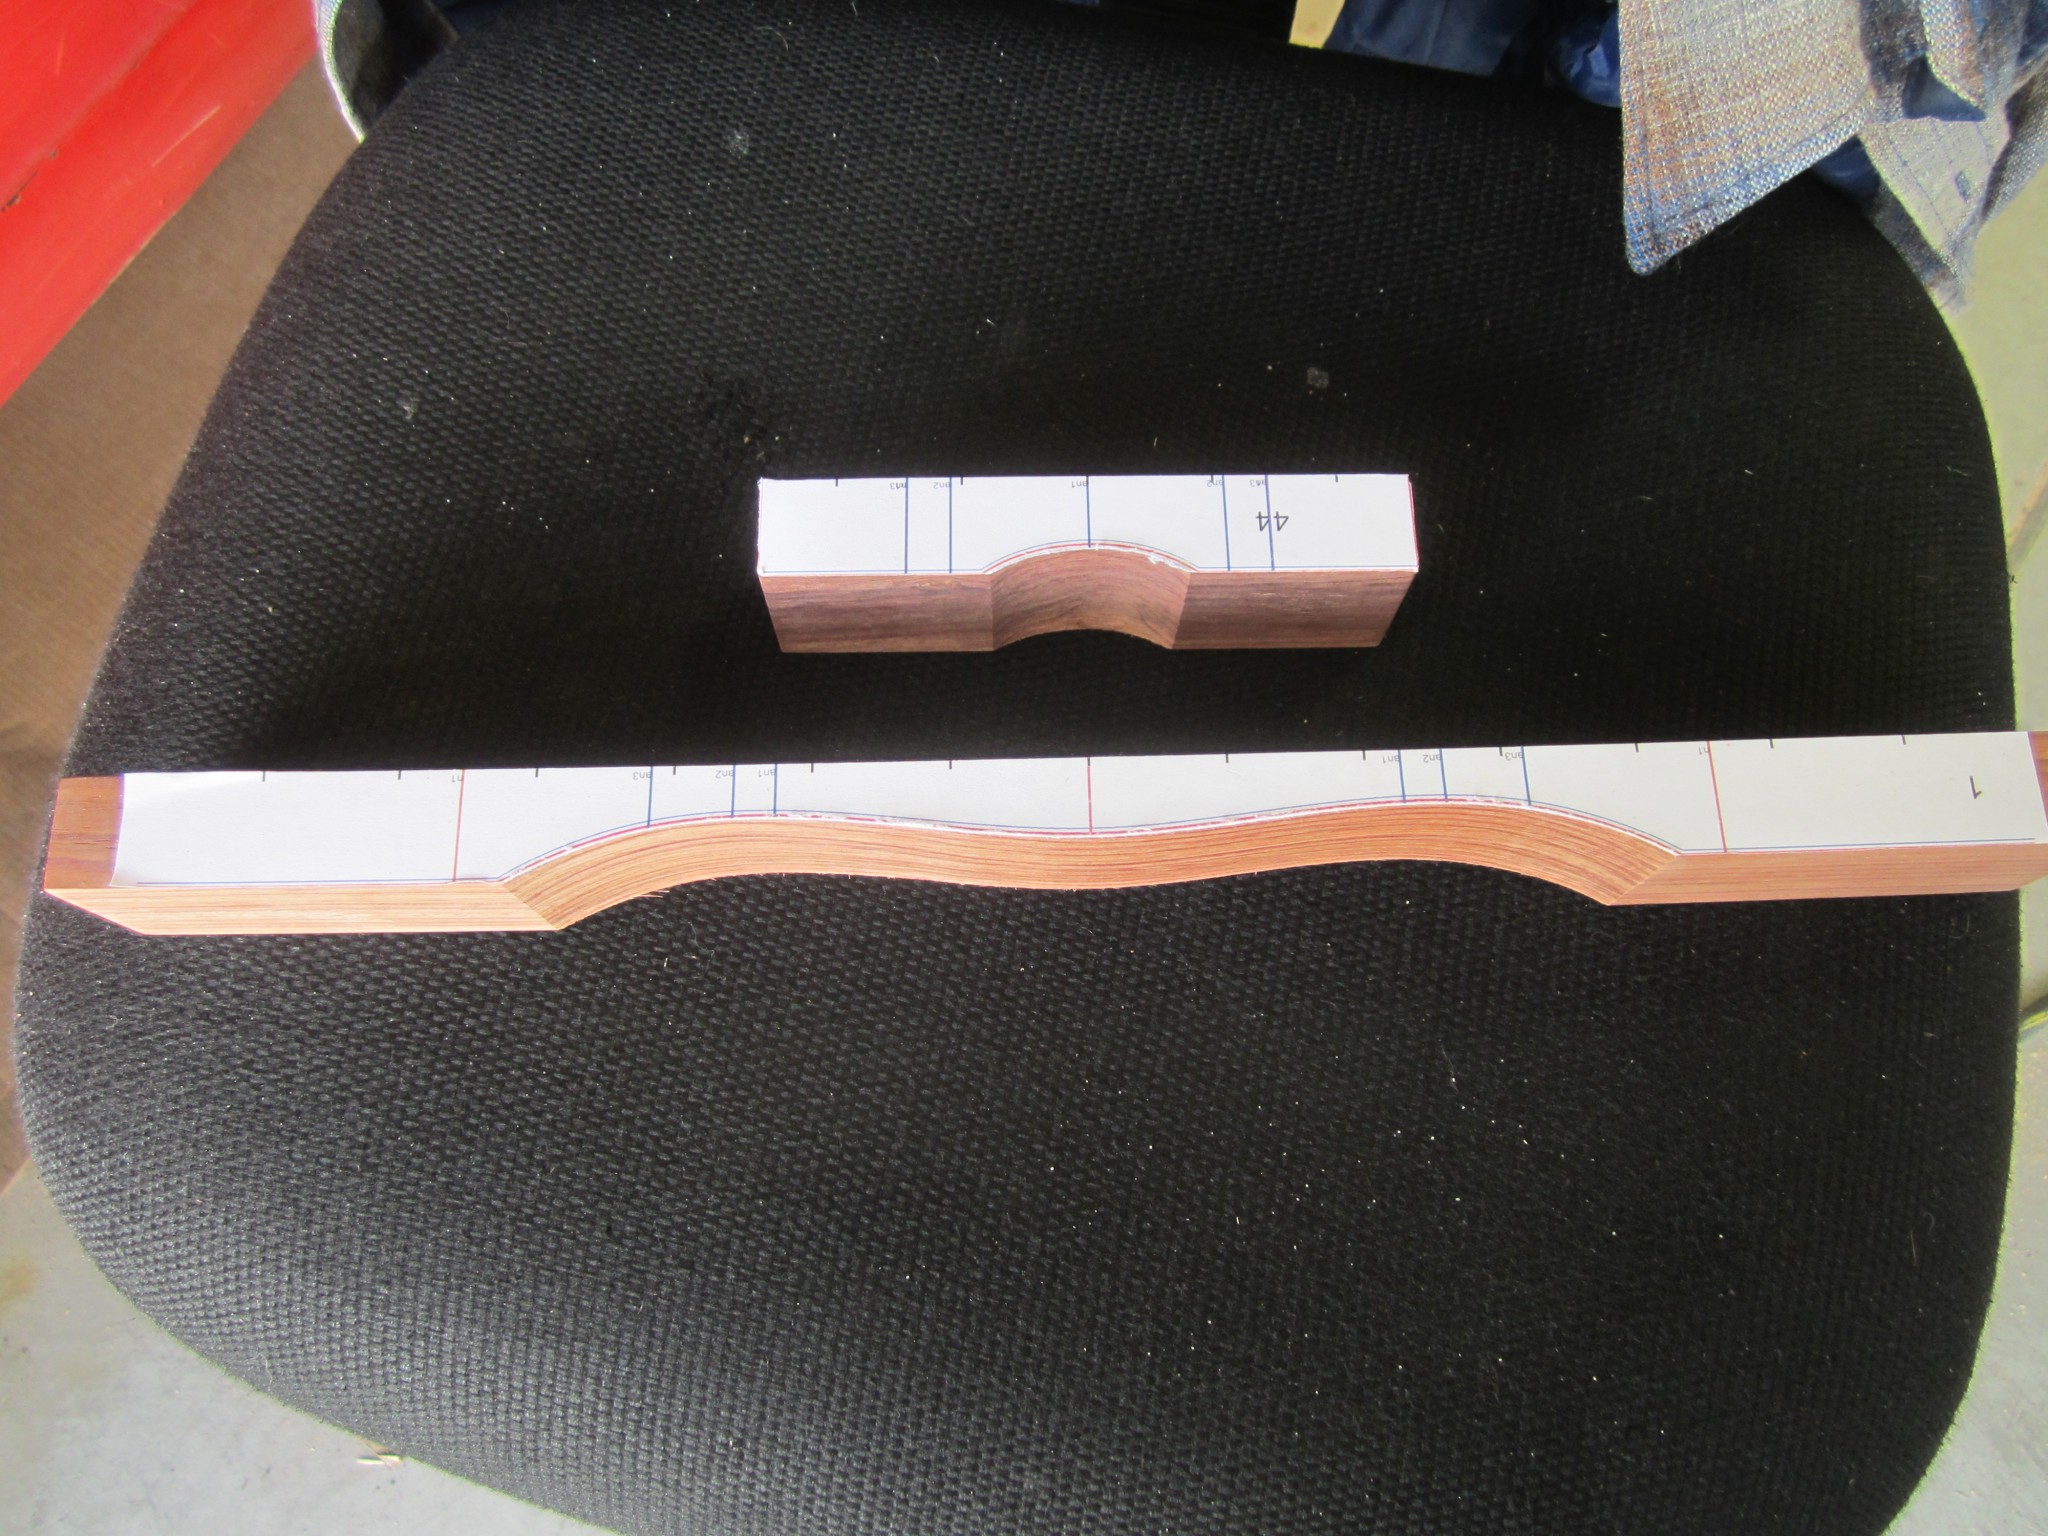
Here is a photo of my longest and shortest bars with the templates attached and the rough shaping complete:
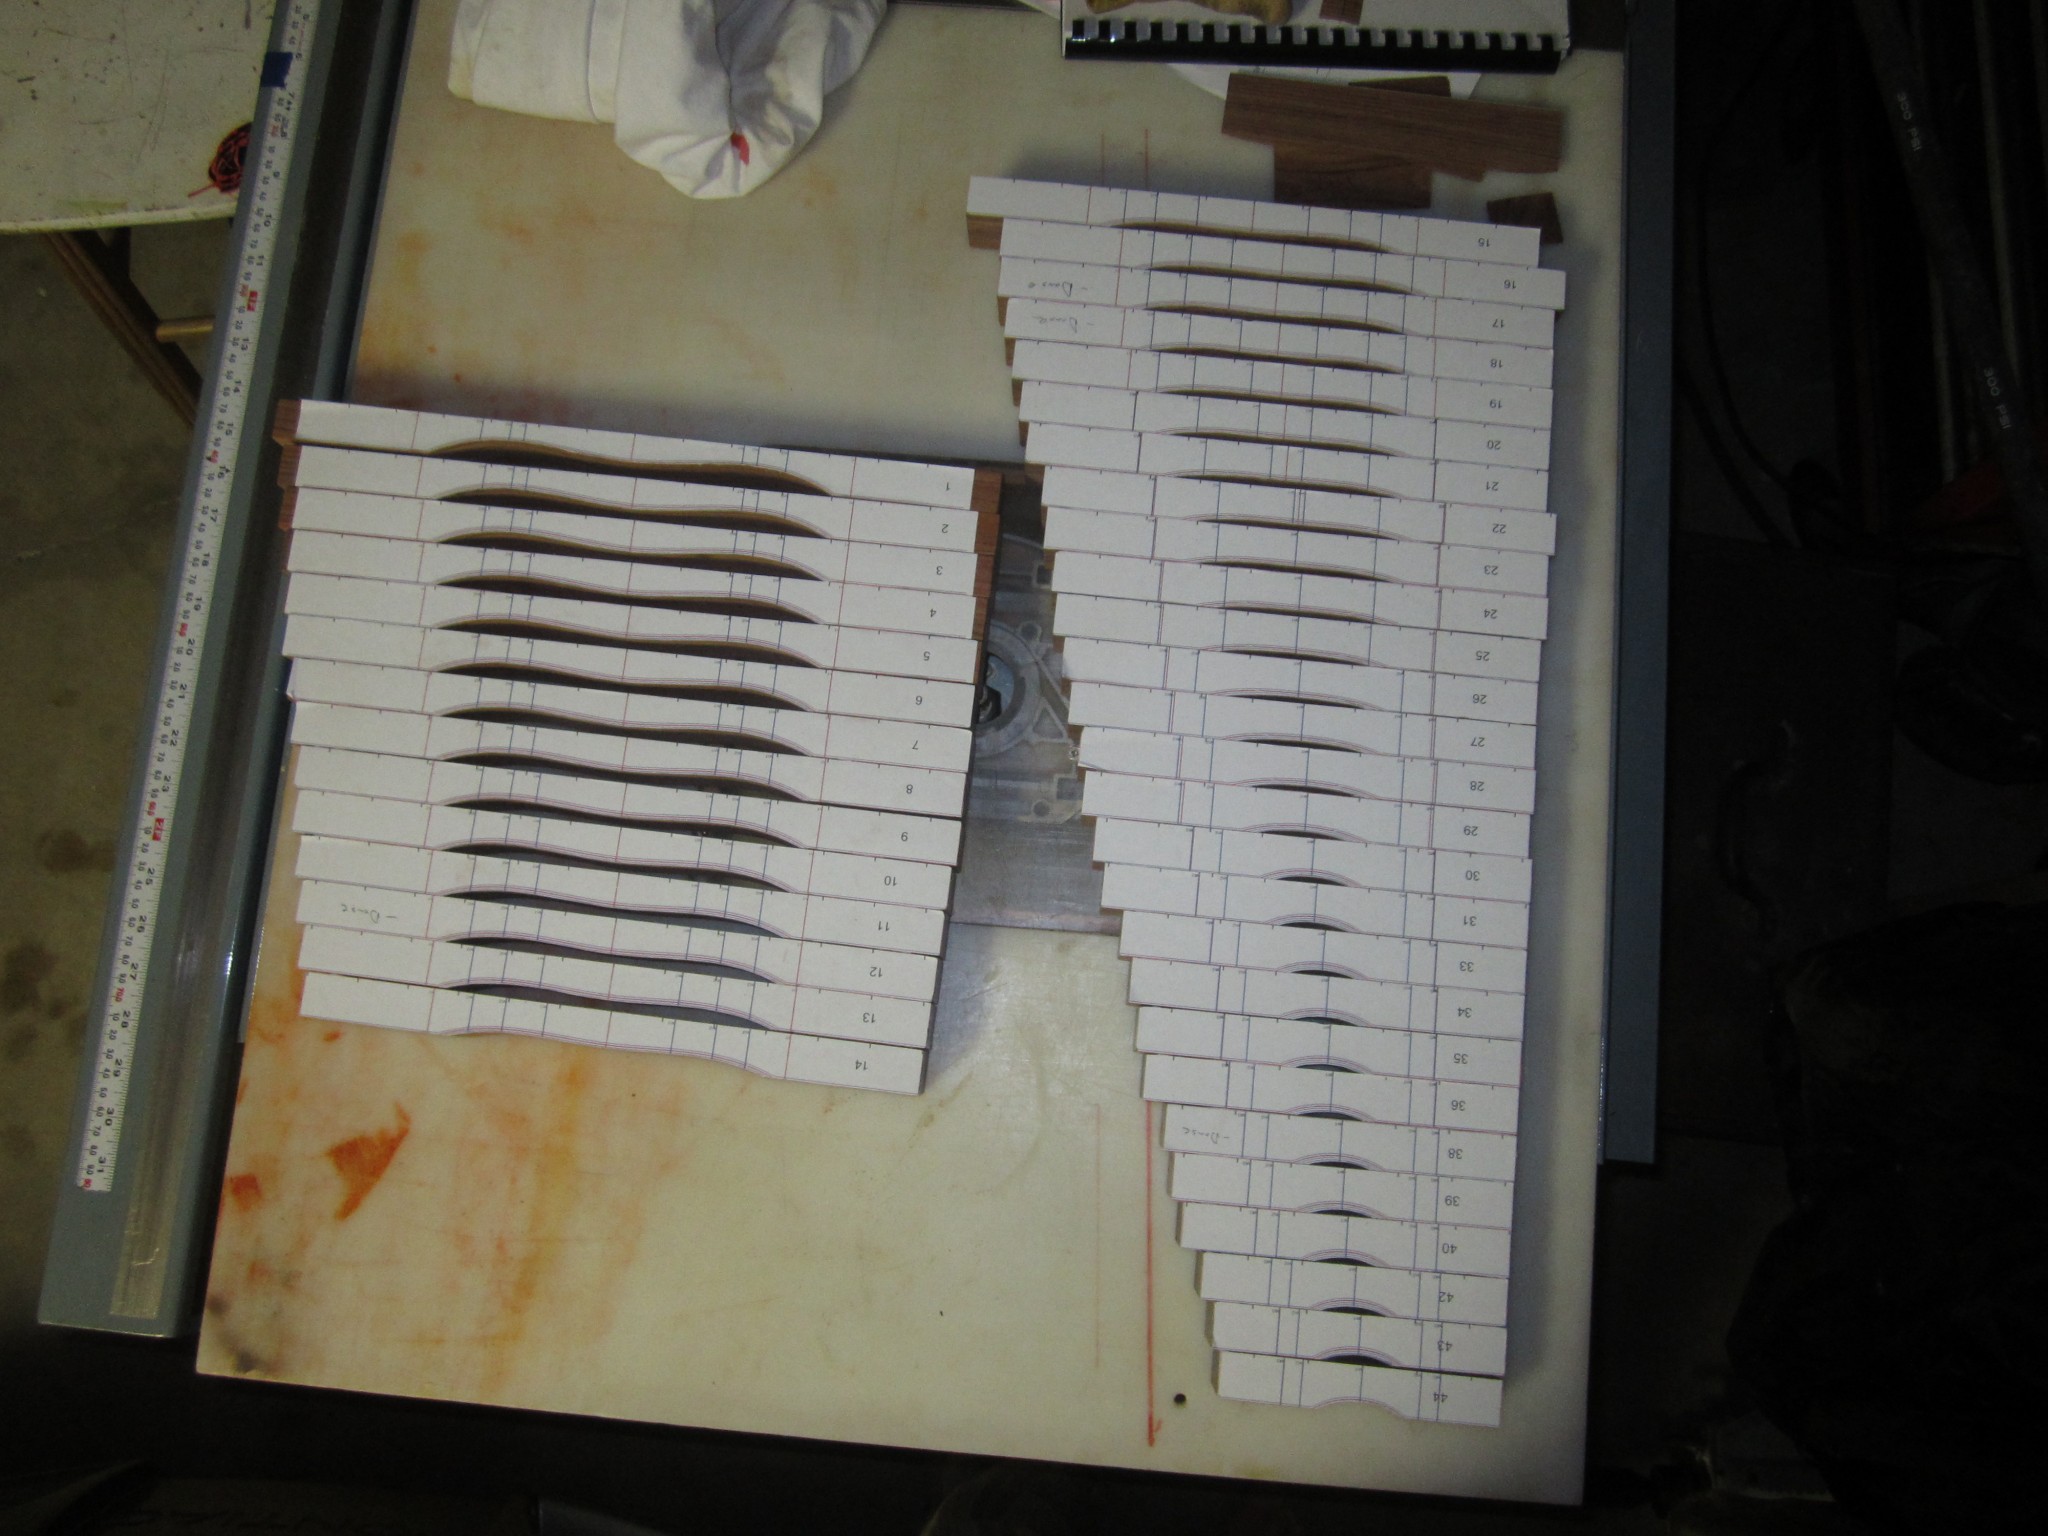
Having had success with cutting and measuring the two bars, we set out to fabricate the other 42. We started by roughly cutting the shape on the band saw. This went much faster than I anticipated and only took a couple of hours. I spent another couple of hours on the drum sander with two goals: 1) remove the saw marks 2) sand to a constant distance from the red computer-generated profile. I wasn’t trying to get all bars to have same standoff distance from the red profile but rather, for each bar, I was just trying to maintain a uniform distance from the red profile. This meant that some bars were 1 mm proud of the red profile, and some were 2+ mm proud. In any case, here is a photo of our 41 “good” bars (i.e., we hadn’t remade the three wacky bars yet).
Now, the critical step was to spectrally measure each of the bars again to ensure that I had sufficient frequency margin to drill the holes and do the final tuning. As I established on the maple bar, the holes had a nearly negligible effect on the long bars, but holes I drilled on a short blank (a remnant that was shorter than even my C8 bar) demonstrated a +2% change in frequency. Here is the result this second spectral analysis:
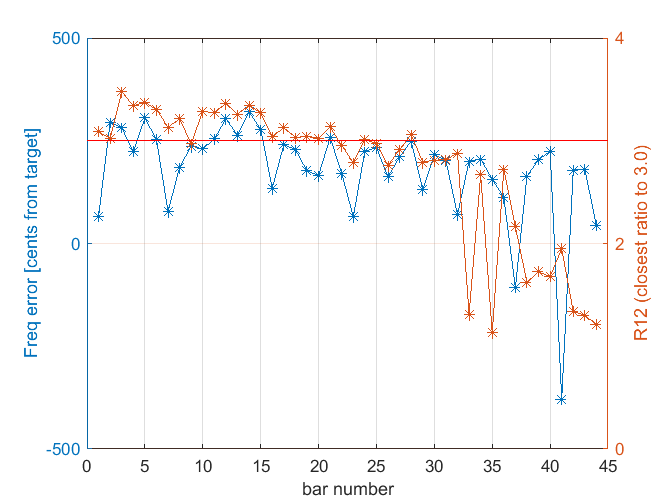
As you can see, all of the 41 “good” bars have a fundamental frequency that is higher than the target; this is great! Plotted in red is the ratio of the first overtone (relative to the target frequency). Note that the code to compute this really just searches for the ratio that is closest to 3.0. Consequently, if the first overtone doesn’t have enough energy to measure, then the code will just find the fundamental, which happens typically happens for bar 32 and above.
As we’ve discussed, I really only care about the second partial on the first 25 or so bars. Beyond that, I doubt that the second partial has enough energy to be audible. Surprisingly, a few of the bars already had a R12 ratio that is < 3.0. This means that I removed a bit too much wood on these bars. During the tuning process, I tried to address this issue, but you will hear more about that later.
Finally, for fun, I will leave you with a wave file that contains the an audio measurement for each bar. Note that the frequencies are not monotonically increasing at this point, since they are just the frequencies that resulted after doing sanding to the uniform offset from the profile. In any case, it is kind of cool to hear the actual bars.
References
S Olutunde Oyadiji and Raad Ali, “Finite element modal analysis of free-free beams and plates: A study of transition from beam-like to plate-like behaviour,” Twelfth international congress on sound and vibration July 2005
Hi. Is it possible to buy these templates for the xylophone bars?
Hi Jason – You don’t need to buy them; I think I included the PDFs for all bars on this site, right?
R