As the previous posts note, the desired frequency ratios for the first 3 partials of a xylophone are 1:3:6. However, I needed to know how accurate these frequencies had to be to yield a nice-sounding instrument. I couldn’t find comments on the web about the tuning accuracy requirements, so I set out to spectrally measure some instruments to serve as a guidepost. Specifically, I needed to know how accurate I needed to tune the fundamental and higher partials.
Finding Sound Samples On the Web
The web was pretty skimpy when it came finding sound clips of xylophones.
Here was the first clip that I found – basically a guy playing a C-major scale. There was no info on the type of xylophone he was playing, but it looked pretty decent.
Here is another video that I found of a DeMarrow instrument. He hits some notes at the end of the video.
Finally, at this site I found a third clip of a guy from the Oregon Symphony playing an xylophone. Again, the I couldn’t find the xylophone brand, but decided it must be a good one if it is used in the symphony.
Spectral Analysis
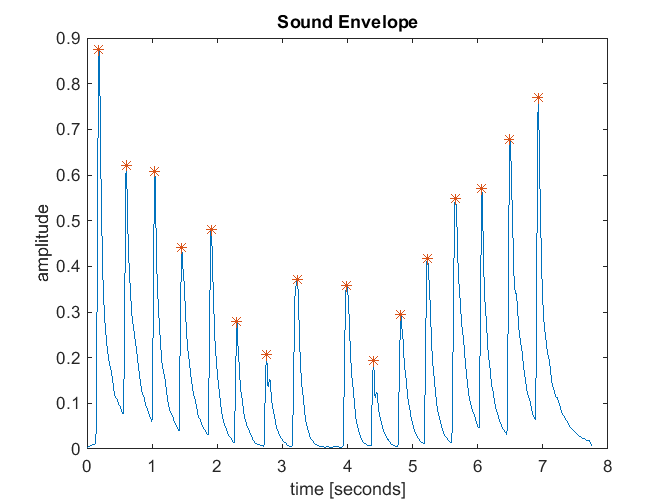
So here is where the magic starts – I wrote some software in Matlab that analyzes these clips to determine how accurately tuned the xylophone is. The tool, called AnalyzeClip, performs the following steps:
- Read the WAV file.
- Delineate each discrete note (i.e., each time a bar is struck) into its own clip.
- For each clip, perform a windowed spectral analysis.
- Find the peaks in the spectrum (aka, the modes). This identifies the frequencies associated with the fundamental frequency and the higher partials.
- Find the fundamental. This is the lowest mode and typically has the most power (although not always – sometimes I found that the second partial had more power.)
- Associate the fundamental with the closest ideal note, assuming an equal-tempered scale with a 442 Hz reference pitch (Wikipedia has a nice description of equal temperament.)
- Compute the frequency error of the fundamental relative to the ideal desired pitch.
The “ideal pitch” noted in the last step is computed for a an equal tempered scale with a 442 Hz reference. The notes in an equal tempered scale have a ratio that is given by 2^(1/12) power, which is about 1.0595. So if you want to determine the frequencies associated with a note, just multiple the previous notes frequency by 1.0595. If you do this multiplication for 12 successive notes, the two bookending notes will have a ration of 2, or an octave apart. For my 3.5 octave xylophone, the following table gives the desired frequency for each note.
Note frequencies
| Bar Number | Note | Frequency |
|---|---|---|
| 1 | F4 | 350.816 |
| 2 | F#4 | 371.676 |
| 3 | G4 | 393.777 |
| 4 | G#4 | 417.192 |
| 5 | A4 | 442.000 |
| 6 | A#4 | 468.283 |
| 7 | B4 | 496.128 |
| 8 | C5 | 525.630 |
| 9 | C#5 | 556.885 |
| 10 | D5 | 589.999 |
| 11 | D#5 | 625.082 |
| 12 | E5 | 662.252 |
| 13 | F5 | 701.631 |
| 14 | F#5 | 743.352 |
| 15 | G5 | 787.554 |
| 16 | G#5 | 834.385 |
| 17 | A5 | 884.000 |
| 18 | A#5 | 936.565 |
| 19 | B5 | 992.256 |
| 20 | C6 | 1051.259 |
| 21 | C#6 | 1113.770 |
| 22 | D6 | 1179.998 |
| 23 | D#6 | 1250.165 |
| 24 | E6 | 1324.503 |
| 25 | F6 | 1403.263 |
| 26 | F#6 | 1486.705 |
| 27 | G6 | 1575.109 |
| 28 | G#6 | 1668.770 |
| 29 | A6 | 1768.000 |
| 30 | A#6 | 1873.131 |
| 31 | B6 | 1984.513 |
| 32 | C7 | 2102.518 |
| 33 | C#7 | 2227.540 |
| 34 | D7 | 2359.997 |
| 35 | D#7 | 2500.330 |
| 36 | E7 | 2649.007 |
| 37 | F7 | 2806.525 |
| 38 | F#7 | 2973.410 |
| 39 | G7 | 3150.218 |
| 40 | G#7 | 3337.540 |
| 41 | A7 | 3536.000 |
| 42 | A#7 | 3746.262 |
| 43 | B7 | 3969.026 |
| 44 | C8 | 4205.036 |
Notice that bar 5 (A4) has a pitch of exactly 442.00 Hz. This is because I referenced all of the other notes to this pitch.
In my next post, I will show some results form the spectral analysis of the sound bites that I found on the web.